
Hut 8 stock rises 4.76% as strong price action holds well above key moving averages

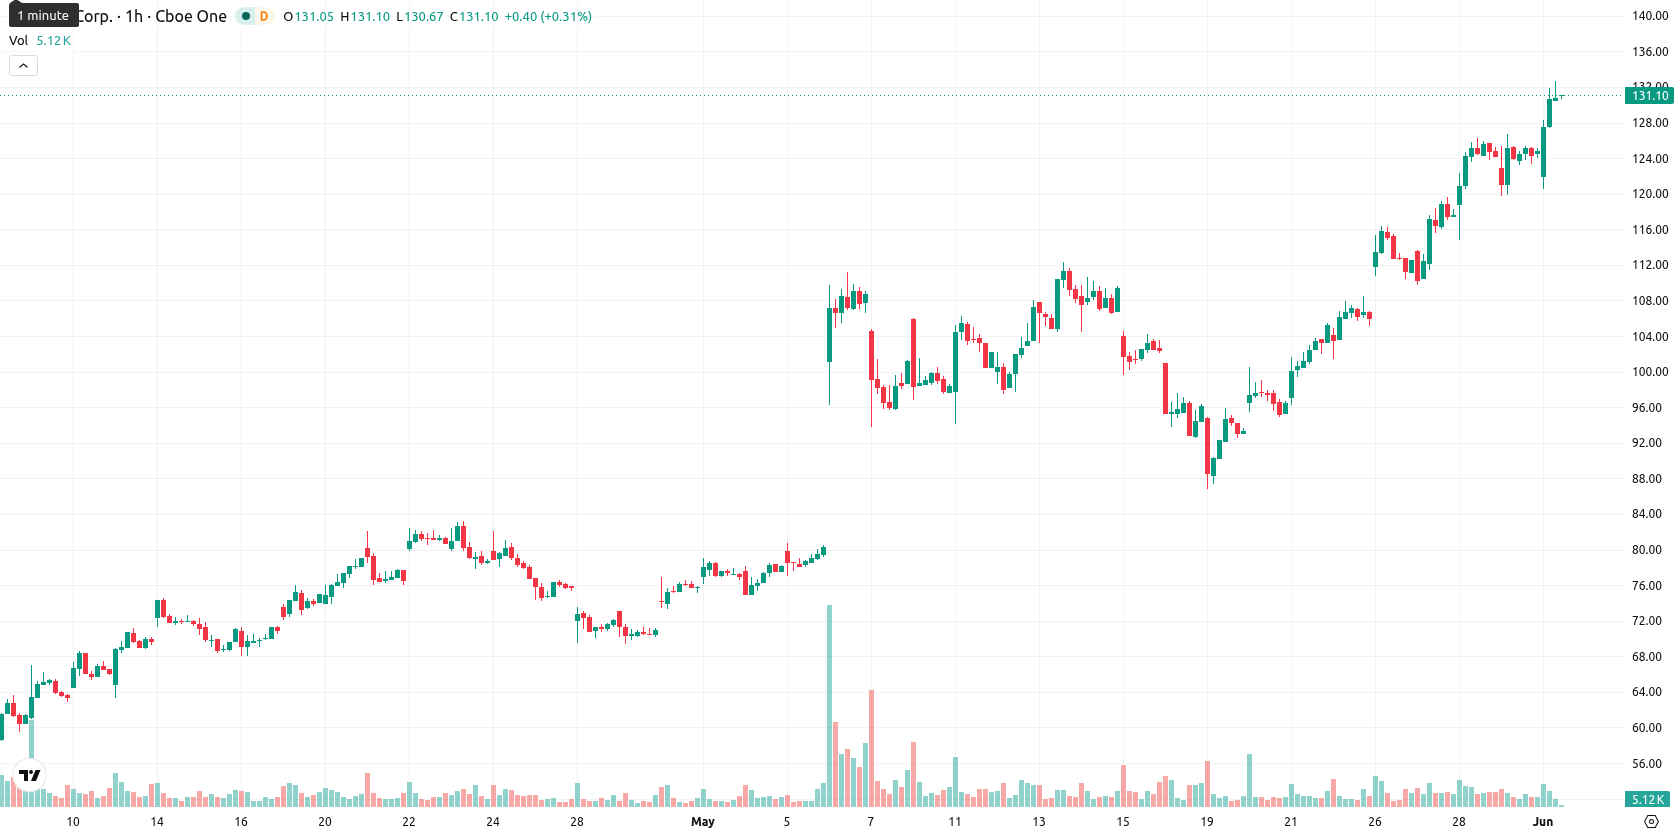
Hut 8 (HUT) stock is trading at $130.77, up 4.76% on the session and holding well above its key moving averages. The price sits comfortably above benchmarks, suggesting sustained momentum compared to recent averages.
Highlights
- Hut 8 maintains a strong bullish trend, trading significantly above short-, medium-, and long-term support levels.
- Technical momentum indicators signal continued upward pressure, though overbought oscillators suggest potential for short-term pullback.
- The projected trading range for the next five sessions is $120 to $144, with a breakout above $144 likely to fuel further gains.
Bullish signals face overbought risks as buyers drive volatility
The technical setup shows HUT holding above the MA-20 at $102.51, MA-50 at $78.62, and MA-200 at $53.01, reinforcing recent bullish momentum. Immediate support lies at the Ichimoku Kijun level of $97.91. On the oscillator front, momentum indicators such as MACD and ADX confirm bullish continuation, while the Awesome Oscillator aligns with the current uptrend. However, the RSI reading of 74.31, Stoch RSI at 98.71, and CCI at 158.77 all flag overbought conditions, and Bull/Bear Power reveals ongoing buyer dominance. Today’s session began with a minor gap down (from $124.83 to $121.95), followed by a rally back to near the session high, highlighting elevated volatility and persistent buying pressure. This strength is partially offset by growing divergence in momentum signals as multiple oscillators flash warnings of overextension.
Consolidation eyed as volatility bands reflect momentum extremes
For the coming week, HUT is likely to trade within a volatility band of $120 to $144, consistent with recent large swings and strong momentum. The most probable scenario is a short-term consolidation in this range as the stock digests recent gains. If price breaks above $144, it may trigger another upward move; conversely, a decline below $120 would require a marked shift in momentum and open the door to a brief pullback.
Earlier, analysts noted that Hut 8 was exhibiting sustained bullish momentum, supported by strong technical signals and robust institutional participation. The current data not only reinforces this outlook but also highlights that traders should closely monitor the $144 level for a potential breakout amid ongoing volatility.


-
 Afghanistan
-
 Albania
-
 Algeria
-
 Angola
-
 Argentina
-
 Armenia
-
 Australia
-
 Austria
-
 Azerbaijan
-
 Bahamas
-
 Bahrain
-
 Bangladesh
-
 Belarus
-
 Belgium
-
 Bolivia
-
 Botswana
-
 Brazil
-
 Brunei
-
 Bulgaria
-
 Cambodia
-
 Cameroon
-
 Canada
-
 Chile
Chile
-
 China
China
-
 Colombia
-
 Congo
Congo
-
 Costa Rica
-
 Cote d'Ivoire
-
 Croatia
-
 Cuba
Cuba
-
 Cyprus
-
 Czechia
-
 DR Congo
-
 Denmark
-
 Dominican Republic
-
 Ecuador
-
 Egypt
Egypt
-
 El Salvador
-
 Estonia
-
 Eswatini
-
 Ethiopia
-
 Finland
-
 France
-
 Georgia
-
 Germany
-
 Ghana
Ghana
-
 Greece
-
 Haiti
Haiti
-
 Hong Kong
-
 Hungary
-
 India
India
-
 Indonesia
-
 Iran, Islamic republic
-
 Iraq
Iraq
-
 Ireland
-
 Israel
-
 Italy
Italy
-
 Jamaica
-
 Japan
Japan
-
 Jordan
-
 Kazakhstan
-
 Kenya
Kenya
-
 Korea
Korea
-
 Kuwait
-
 Kyrgyzstan
-
 Laos
Laos
-
 Latvia
-
 Lebanon
-
 Lesotho
-
 Libya
Libya
-
 Lithuania
-
 Luxembourg
-
 Madagascar
-
 Malaysia
-
 Malta
Malta
-
 Mauritius
-
 Mexico
-
 Moldova
-
 Mongolia
-
 Montenegro
-
 Morocco
-
 Mozambique
-
 Myanmar
-
 Namibia
-
 Nepal
Nepal
-
 Netherlands
-
 New Zealand
-
 Nigeria
-
 North Macedonia
-
 Norway
-
 Oman
Oman
-
 Pakistan
-
 Palestine
-
 Panama
-
 Papua New Guinea
-
 Paraguay
-
 Peru
Peru
-
 Philippines
-
 Poland
-
 Portugal
-
 Puerto Rico
-
 Qatar
Qatar
-
 Reunion
-
 Romania
-
 Rwanda
-
 Saudi Arabia
-
 Serbia
-
 Singapore
-
 Slovakia
-
 Slovenia
-
 Somalia
-
 South Africa
-
 Spain
Spain
-
 Sri Lanka
-
 Sweden
-
 Switzerland
-
 Syria
Syria
-
 Taiwan
-
 Tajikistan
-
 Tanzania
-
 Thailand
-
 Trinidad and Tobago
-
 Tunisia
-
 Turkey
-
 UAE
UAE
-
 Uganda
-
 Ukraine
-
 United Kingdom
-
United States
-
 Uruguay
-
 Uzbekistan
-
 Venezuela
-
 Vietnam
-
 Yemen
Yemen
-
 Zambia
-
 Zimbabwe
- Forex
- Crypto
