
-3.40% for Palo Alto Networks stock as intraday session favors sellers

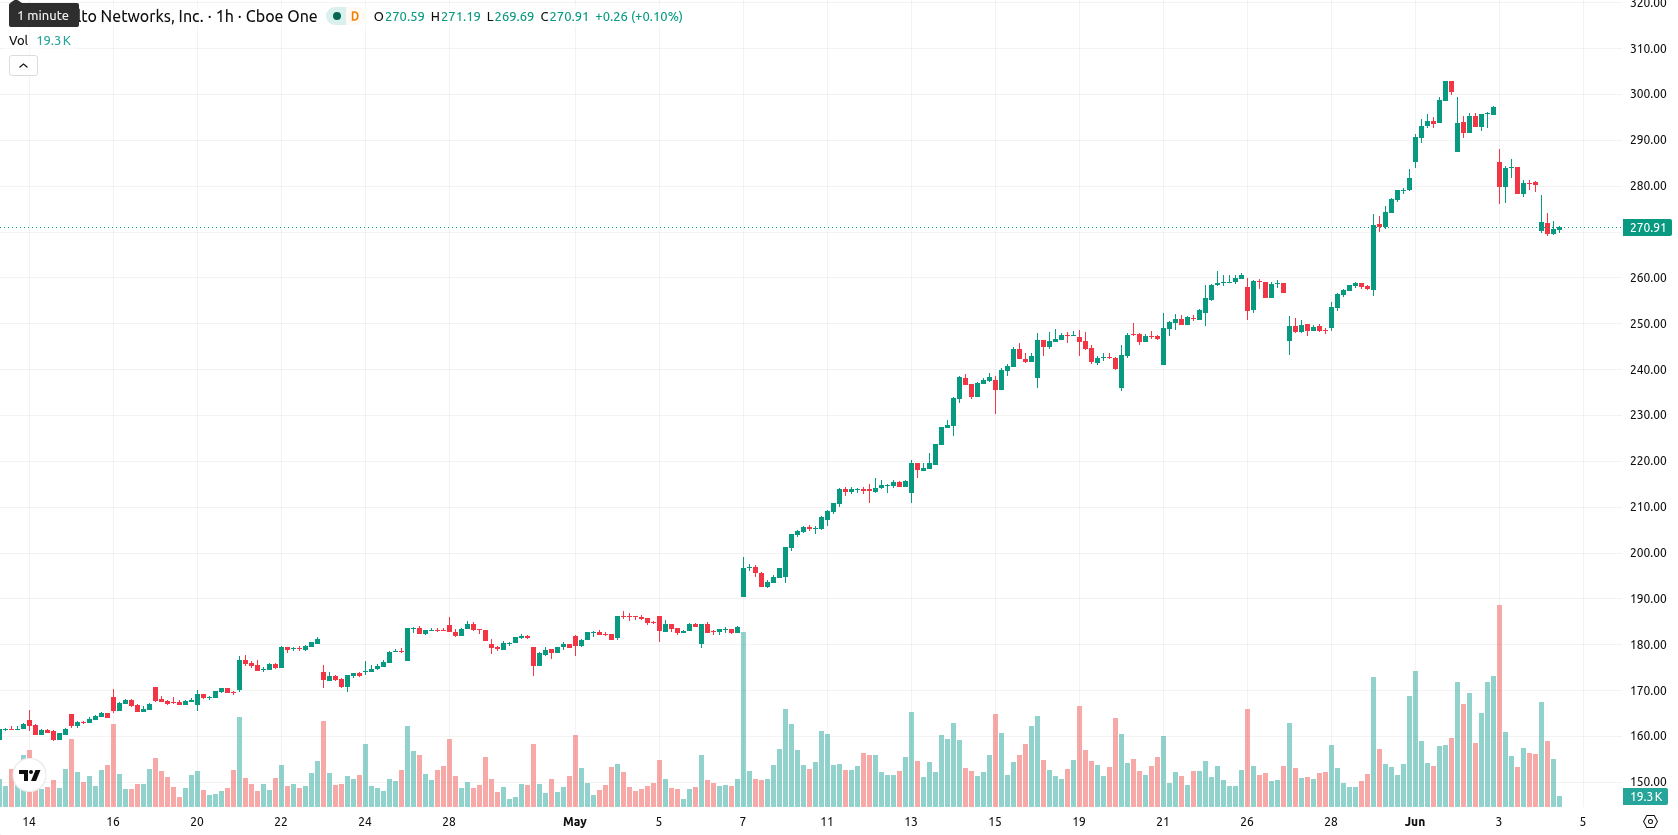
Palo Alto Networks (PANW) stock is trading at $270.89, posting a daily decline of 3.40%. The stock sits below its main short- and medium-term moving averages, marking notable downward momentum through the session.
Highlights
- Palo Alto Networks grew revenue 31% year-over-year to $3 billion and raised full-year guidance on strong core business momentum.
- Next-Generation Security Annual Recurring Revenue surged 60% to $8.1 billion as AI-driven cybersecurity demand accelerated post-acquisitions.
- PANW trades below short- and medium-term moving averages with momentum and oscillators signaling oversold conditions; expected trading range is $250.09 to $291.69, with downside risk prevailing short-term.
AI-driven security demand fuels earnings growth as selling persists
Palo Alto Networks reported strong third-quarter fiscal 2026 results, with revenue reaching $3 billion and delivering a 31% year-over-year increase. Management raised full-year guidance, citing ongoing momentum in core business lines alongside the successful integration of recent acquisitions, such as CyberArk and Chronosphere. Next-Generation Security Annual Recurring Revenue expanded 60% to $8.1 billion as demand for AI-powered cybersecurity solutions accelerated. CEO Nikesh Arora emphasized that advances in frontier AI have created new autonomous threat dynamics, intensifying market urgency for enhanced security capabilities, though price action has remained under broader selling pressure.
Oversold pressures and resistance reinforce sustained bearish momentum
On the h1 chart, PANW is trading below both the MA-20 at $287.13 and the MA-50 at $273.58, while maintaining positioning above the MA-200 on the daily at $191.16. The Ichimoku Kijun level at $286.03 is acting as immediate resistance. RSI is at 36.64, reflecting sell territory, with the ADX indicating a sell and the MACD currently neutral. The Awesome Oscillator confirms the prevailing downtrend, while both CCI and Stoch RSI mark oversold conditions and the BBP indicator is also oversold, highlighting dominant seller pressure within the intraday session.
Rangebound trading seen as downward bias dominates outlook
Over the next several days, PANW is likely to remain within a volatility band between $250.09 and $291.69, with probabilities tilted 55% toward a downward move and 45% toward an upward move. A price rebound above resistance at $286.03 would be required to improve sentiment and signal a possible upside scenario. If the price decisively breaks below $250.09, it could trigger an acceleration in seller activity and further downside momentum. The baseline scenario anticipates the stock remaining rangebound inside this corridor unless a catalyst emerges.
In a recent review, analysts highlighted Palo Alto Networks' strong bullish momentum while cautioning that overbought conditions and market volatility could pose short-term risks. With the stock now under renewed selling pressure and trading momentum shifted to the downside, investors should closely monitor the $250.09 support level as a potential inflection point for further downside or a stabilization phase.


Latest Palo Alto Networks News


-
 Afghanistan
-
 Albania
-
 Algeria
-
 Angola
-
 Argentina
-
 Armenia
-
 Australia
-
 Austria
-
 Azerbaijan
-
 Bahamas
-
 Bahrain
-
 Bangladesh
-
 Belarus
-
 Belgium
-
 Bolivia
-
 Botswana
-
 Brazil
-
 Brunei
-
 Bulgaria
-
 Cambodia
-
 Cameroon
-
 Canada
-
 Chile
Chile
-
 China
China
-
 Colombia
-
 Congo
Congo
-
 Costa Rica
-
 Cote d'Ivoire
-
 Croatia
-
 Cuba
Cuba
-
 Cyprus
-
 Czechia
-
 DR Congo
-
 Denmark
-
 Dominican Republic
-
 Ecuador
-
 Egypt
Egypt
-
 El Salvador
-
 Estonia
-
 Eswatini
-
 Ethiopia
-
 Finland
-
 France
-
 Georgia
-
 Germany
-
 Ghana
Ghana
-
 Greece
-
 Haiti
Haiti
-
 Hong Kong
-
 Hungary
-
 India
India
-
 Indonesia
-
 Iran, Islamic republic
-
 Iraq
Iraq
-
 Ireland
-
 Israel
-
 Italy
Italy
-
 Jamaica
-
 Japan
Japan
-
 Jordan
-
 Kazakhstan
-
 Kenya
Kenya
-
 Korea
Korea
-
 Kuwait
-
 Kyrgyzstan
-
 Laos
Laos
-
 Latvia
-
 Lebanon
-
 Lesotho
-
 Libya
Libya
-
 Lithuania
-
 Luxembourg
-
 Madagascar
-
 Malaysia
-
 Malta
Malta
-
 Mauritius
-
 Mexico
-
 Moldova
-
 Mongolia
-
 Montenegro
-
 Morocco
-
 Mozambique
-
 Myanmar
-
 Namibia
-
 Nepal
Nepal
-
 Netherlands
-
 New Zealand
-
 Nigeria
-
 North Macedonia
-
 Norway
-
 Oman
Oman
-
 Pakistan
-
 Palestine
-
 Panama
-
 Papua New Guinea
-
 Paraguay
-
 Peru
Peru
-
 Philippines
-
 Poland
-
 Portugal
-
 Puerto Rico
-
 Qatar
Qatar
-
 Reunion
-
 Romania
-
 Rwanda
-
 Saudi Arabia
-
 Serbia
-
 Singapore
-
 Slovakia
-
 Slovenia
-
 Somalia
-
 South Africa
-
 Spain
Spain
-
 Sri Lanka
-
 Sweden
-
 Switzerland
-
 Syria
Syria
-
 Taiwan
-
 Tajikistan
-
 Tanzania
-
 Thailand
-
 Trinidad and Tobago
-
 Tunisia
-
 Turkey
-
 UAE
UAE
-
 Uganda
-
 Ukraine
-
 United Kingdom
-
United States
-
 Uruguay
-
 Uzbekistan
-
 Venezuela
-
 Vietnam
-
 Yemen
Yemen
-
 Zambia
-
 Zimbabwe
- Forex
- Crypto
