
Apple stock price forecast: $302.39 resistance in focus as AAPL gains 1.80%

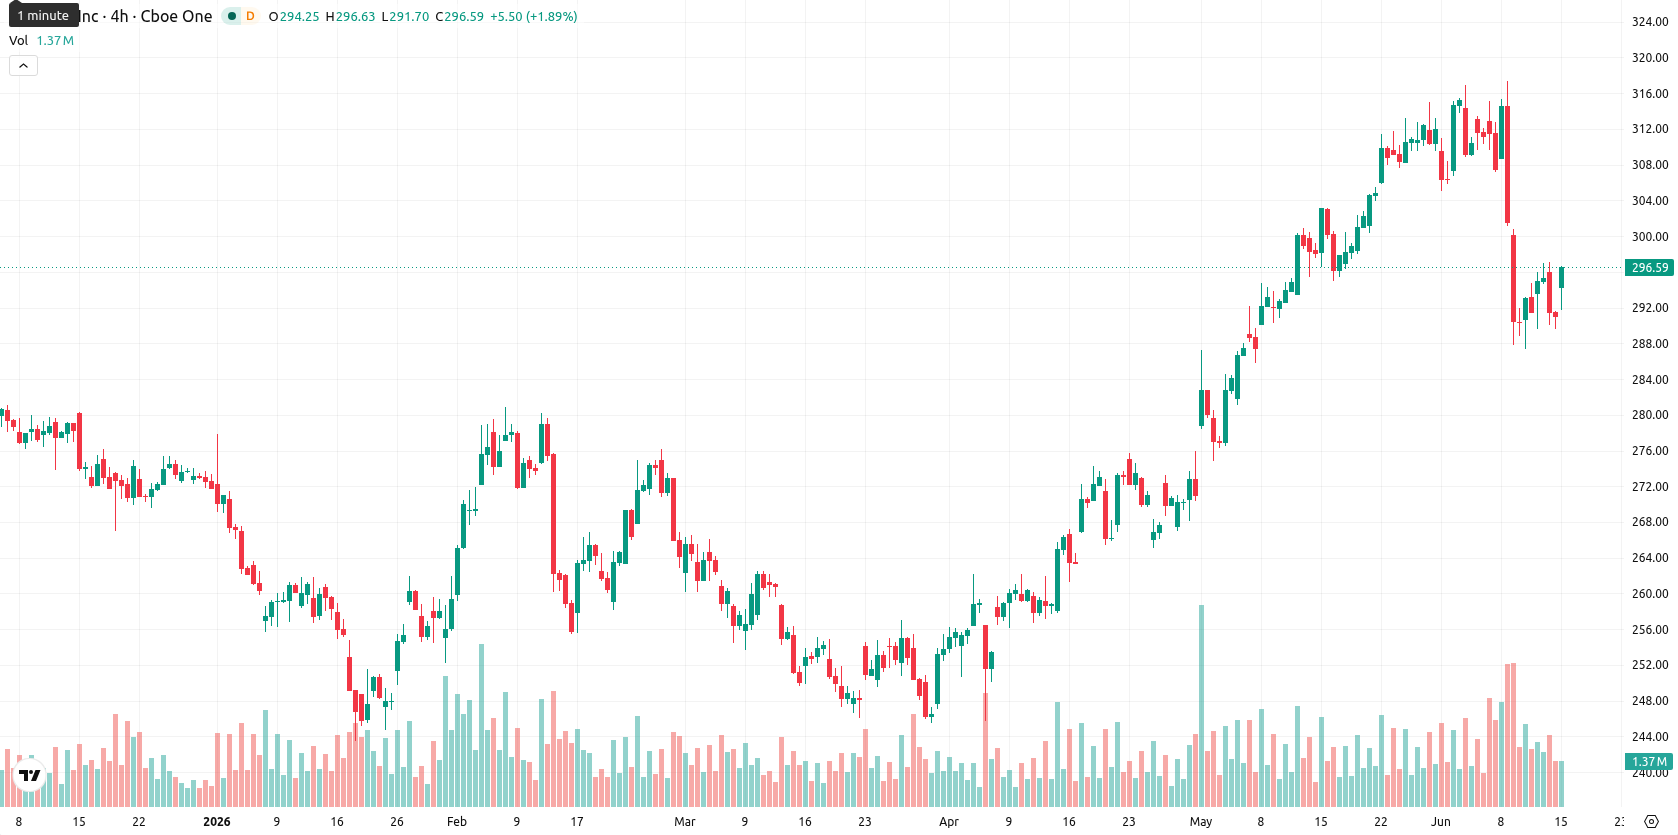
Apple Inc. (AAPL) stock is trading at $296.68, showing a daily gain of 1.80%. The price sits below its key short- and medium-term moving averages, while holding above long-term levels.
Highlights
- Apple faces heightened regulatory and operational uncertainty after an Indian pollution board threatened to shut a key Tata Electronics supplier plant over alleged groundwater contamination.
- Escalating geopolitical tensions, new tariffs, and increased threats of supply chain disruptions further elevate Apple's risk exposure and potential production costs.
- AAPL trades below short-term moving averages with a bearish momentum bias, and is expected to remain range-bound between $290.00 and $303.37 over the next few days.
Supply chain risk grows as regulations threaten Indian partner
Apple is facing increased geopolitical risk after an Indian pollution board alleged that a Tata Electronics plant supplying iPhone components has contaminated local groundwater, threatening to shut the facility down unless compliance is demonstrated. This development introduces direct regulatory and operational uncertainty for Apple's supply chain, possibly affecting production continuity and costs tied to one of its major component partners. Additional external pressure arises from heightened geopolitical tensions, tariffs, and fresh threats of supply chain disruptions among critical suppliers, further weighing on the risk environment.
Technical pressure mounts as momentum signals diverge
On the H4 chart, AAPL is positioned below both the MA-20 and MA-50, indicating short- and medium-term technical pressure, while the daily chart places the price above the MA-200, signaling continued long-term support. Resistance is defined by the Ichimoku Kijun level at $302.39. Key momentum indicators — MACD and ADX — register sell signals, with RSI and CCI also remaining in the sell zone. Both Stoch RSI and BBP indicate oversold conditions, reflecting intraday seller dominance, while the Awesome Oscillator is neutral and not actively confirming the prevailing trend.
Range-bound action likely as downside risk holds
Over the next two to three trading days, the price is expected to fluctuate within a typical volatility band between $290.00 and $303.37. The probability of an immediate upward move stands at 36%, while a downside break remains more likely in current conditions. The baseline scenario anticipates continued range-bound action; however, a break above resistance at $302.39 may trigger a rally, whereas a drop below $290.00 would reinforce prevailing bearish momentum.
Earlier, analysts noted that while Apple’s long-term outlook remained constructive, persistent concerns surrounded its AI strategy execution amid ongoing technical and legal headwinds. The emergence of fresh regulatory risk tied to its Indian supply chain partner adds another layer of complexity and could intensify volatility, making the $302.39 resistance a critical level to monitor for signs of either sustained recovery or further downside pressure.


Latest Apple News


-
 Afghanistan
-
 Albania
-
 Algeria
-
 Angola
-
 Argentina
-
 Armenia
-
 Australia
-
 Austria
-
 Azerbaijan
-
 Bahamas
-
 Bahrain
-
 Bangladesh
-
 Belarus
-
 Belgium
-
 Bolivia
-
 Botswana
-
 Brazil
-
 Brunei
-
 Bulgaria
-
 Cambodia
-
 Cameroon
-
 Canada
-
 Chile
Chile
-
 China
China
-
 Colombia
-
 Congo
Congo
-
 Costa Rica
-
 Cote d'Ivoire
-
 Croatia
-
 Cuba
Cuba
-
 Cyprus
-
 Czechia
-
 DR Congo
-
 Denmark
-
 Dominican Republic
-
 Ecuador
-
 Egypt
Egypt
-
 El Salvador
-
 Estonia
-
 Eswatini
-
 Ethiopia
-
 Finland
-
 France
-
 Georgia
-
 Germany
-
 Ghana
Ghana
-
 Greece
-
 Haiti
Haiti
-
 Hong Kong
-
 Hungary
-
 India
India
-
 Indonesia
-
 Iran, Islamic republic
-
 Iraq
Iraq
-
 Ireland
-
 Israel
-
 Italy
Italy
-
 Jamaica
-
 Japan
Japan
-
 Jordan
-
 Kazakhstan
-
 Kenya
Kenya
-
 Korea
Korea
-
 Kuwait
-
 Kyrgyzstan
-
 Laos
Laos
-
 Latvia
-
 Lebanon
-
 Lesotho
-
 Libya
Libya
-
 Lithuania
-
 Luxembourg
-
 Madagascar
-
 Malaysia
-
 Malta
Malta
-
 Mauritius
-
 Mexico
-
 Moldova
-
 Mongolia
-
 Montenegro
-
 Morocco
-
 Mozambique
-
 Myanmar
-
 Namibia
-
 Nepal
Nepal
-
 Netherlands
-
 New Zealand
-
 Nigeria
-
 North Macedonia
-
 Norway
-
 Oman
Oman
-
 Pakistan
-
 Palestine
-
 Panama
-
 Papua New Guinea
-
 Paraguay
-
 Peru
Peru
-
 Philippines
-
 Poland
-
 Portugal
-
 Puerto Rico
-
 Qatar
Qatar
-
 Reunion
-
 Romania
-
 Rwanda
-
 Saudi Arabia
-
 Serbia
-
 Singapore
-
 Slovakia
-
 Slovenia
-
 Somalia
-
 South Africa
-
 Spain
Spain
-
 Sri Lanka
-
 Sweden
-
 Switzerland
-
 Syria
Syria
-
 Taiwan
-
 Tajikistan
-
 Tanzania
-
 Thailand
-
 Trinidad and Tobago
-
 Tunisia
-
 Turkey
-
 UAE
UAE
-
 Uganda
-
 Ukraine
-
 United Kingdom
-
United States
-
 Uruguay
-
 Uzbekistan
-
 Venezuela
-
 Vietnam
-
 Yemen
Yemen
-
 Zambia
-
 Zimbabwe
- Forex
- Crypto
