
-3.17% for AMD stock as intraday technicals limit pullback

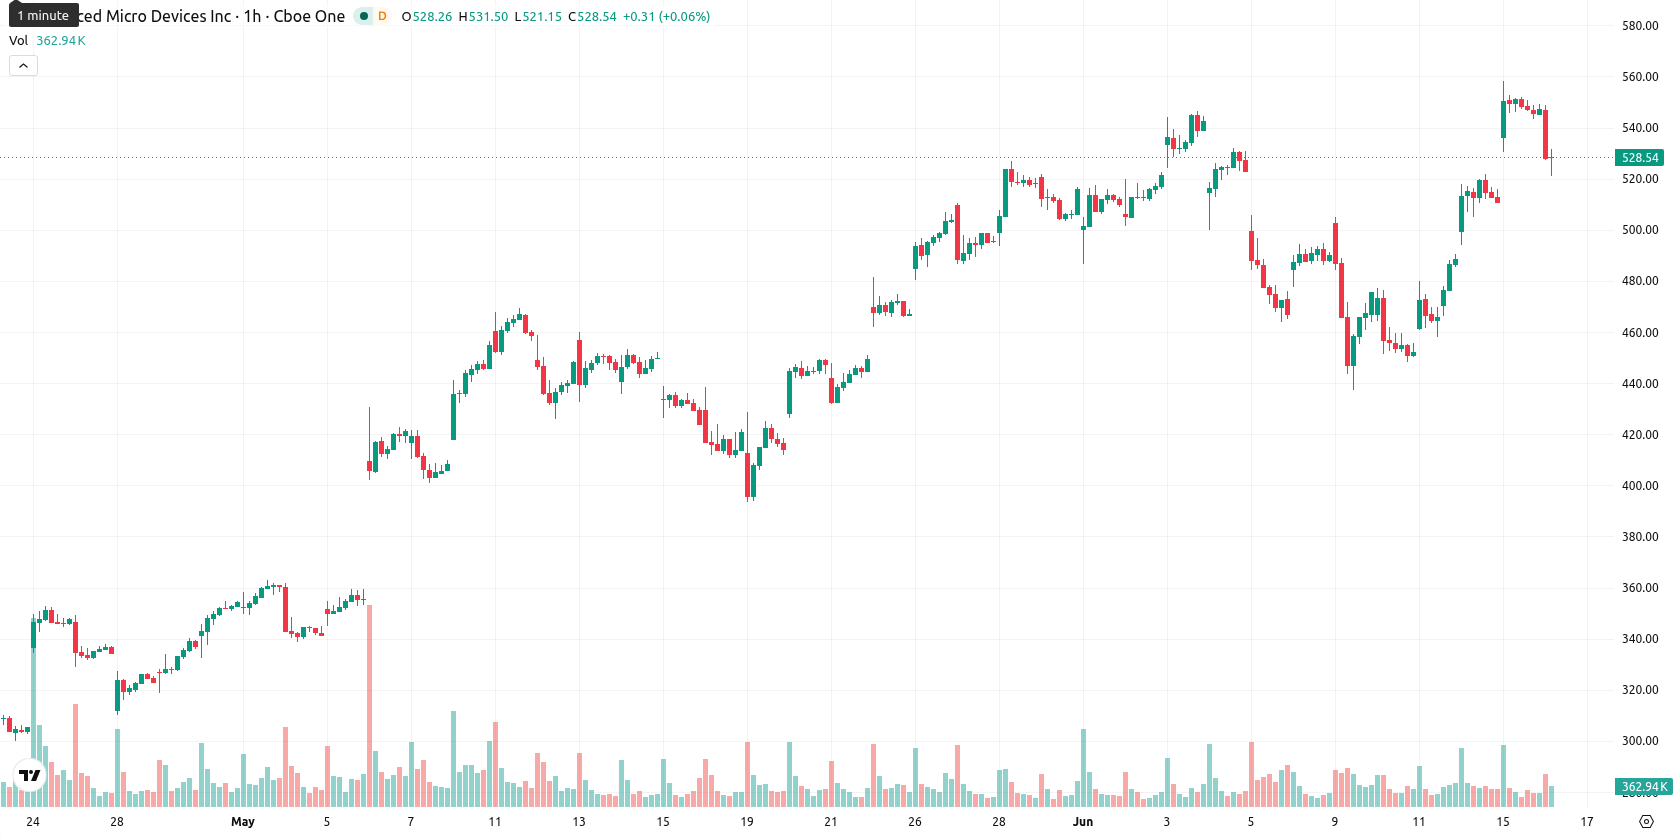
Advanced Micro Devices, Inc. (AMD) stock is trading at $529.83, showing a decline of 3.17% on the day. The stock currently sits above its key short, medium, and long-term moving averages.
Highlights
- Rackspace partners with AMD to drive its enterprise AI strategy, channeling resources toward AMD-powered infrastructure solutions.
- Rackspace will reduce its workforce by 15% to fund AI technology advancement, underscoring higher capital allocation to the AMD collaboration.
- Despite short-term negative price action and high volatility, AMD shows strong bullish momentum with a projected trading range of $482.27 to $577.39.
Enterprise AI focus grows as Rackspace deepens AMD partnership
Rackspace has entered into a formal collaboration with AMD to support its artificial intelligence transformation, highlighting AMD's role as a technology provider for emerging enterprise AI platforms. As part of this initiative, Rackspace will implement a 15% reduction in its workforce to reallocate capital toward these efforts, suggesting an increased focus on infrastructure powered by AMD solutions. These developments point to AMD's continued expansion within enterprise markets for AI, though price action has remained under broader selling pressure.
Mixed momentum signals as buyers test overbought technical range
On the technical front, AMD’s price is above the MA-20 ($521.37) and MA-50 ($490.72) on the H1 chart, and remains well above the MA-200 ($255.81) on the daily timeframe. The Ichimoku Kijun sits at $502.09, now serving as immediate support. Oscillator readings are mixed: MACD and ADX confirm ongoing upward momentum intraday, while RSI and CCI remain in Buy territory. At the same time, Stoch RSI shows an oversold condition and BBP is overbought, suggesting dominance by buyers but with signs of possible intraday exhaustion. The Awesome Oscillator provides a neutral signal.
Upside favored as price nears volatility band resistance
Looking ahead, AMD is expected to trade within a typical volatility band of $482.27 to $577.39 over the next few sessions. With current signals assigning a 70% probability to an upward move, a reversal to the downside is assessed as less likely. If prices consolidate within this corridor, a period of sideways trading may persist; a breakout above resistance could signal accelerated upside, while a sustained move below support would expose the stock to further downside.
Previously it was reported that analysts expected AMD to consolidate before a potential directional breakout, given its robust technical momentum. With new enterprise partnerships fueling AI growth and technical signals still favoring buyers, investors should watch for a decisive move outside the $482.27–$577.39 range as the key trigger for AMD’s next directional trend.


Latest AMD News


-
 Afghanistan
-
 Albania
-
 Algeria
-
 Angola
-
 Argentina
-
 Armenia
-
 Australia
-
 Austria
-
 Azerbaijan
-
 Bahamas
-
 Bahrain
-
 Bangladesh
-
 Belarus
-
 Belgium
-
 Bolivia
-
 Botswana
-
 Brazil
-
 Brunei
-
 Bulgaria
-
 Cambodia
-
 Cameroon
-
 Canada
-
 Chile
Chile
-
 China
China
-
 Colombia
-
 Congo
Congo
-
 Costa Rica
-
 Cote d'Ivoire
-
 Croatia
-
 Cuba
Cuba
-
 Cyprus
-
 Czechia
-
 DR Congo
-
 Denmark
-
 Dominican Republic
-
 Ecuador
-
 Egypt
Egypt
-
 El Salvador
-
 Estonia
-
 Eswatini
-
 Ethiopia
-
 Finland
-
 France
-
 Georgia
-
 Germany
-
 Ghana
Ghana
-
 Greece
-
 Haiti
Haiti
-
 Hong Kong
-
 Hungary
-
 India
India
-
 Indonesia
-
 Iran, Islamic republic
-
 Iraq
Iraq
-
 Ireland
-
 Israel
-
 Italy
Italy
-
 Jamaica
-
 Japan
Japan
-
 Jordan
-
 Kazakhstan
-
 Kenya
Kenya
-
 Korea
Korea
-
 Kuwait
-
 Kyrgyzstan
-
 Laos
Laos
-
 Latvia
-
 Lebanon
-
 Lesotho
-
 Libya
Libya
-
 Lithuania
-
 Luxembourg
-
 Madagascar
-
 Malaysia
-
 Malta
Malta
-
 Mauritius
-
 Mexico
-
 Moldova
-
 Mongolia
-
 Montenegro
-
 Morocco
-
 Mozambique
-
 Myanmar
-
 Namibia
-
 Nepal
Nepal
-
 Netherlands
-
 New Zealand
-
 Nigeria
-
 North Macedonia
-
 Norway
-
 Oman
Oman
-
 Pakistan
-
 Palestine
-
 Panama
-
 Papua New Guinea
-
 Paraguay
-
 Peru
Peru
-
 Philippines
-
 Poland
-
 Portugal
-
 Puerto Rico
-
 Qatar
Qatar
-
 Reunion
-
 Romania
-
 Rwanda
-
 Saudi Arabia
-
 Serbia
-
 Singapore
-
 Slovakia
-
 Slovenia
-
 Somalia
-
 South Africa
-
 Spain
Spain
-
 Sri Lanka
-
 Sweden
-
 Switzerland
-
 Syria
Syria
-
 Taiwan
-
 Tajikistan
-
 Tanzania
-
 Thailand
-
 Trinidad and Tobago
-
 Tunisia
-
 Turkey
-
 UAE
UAE
-
 Uganda
-
 Ukraine
-
 United Kingdom
-
United States
-
 Uruguay
-
 Uzbekistan
-
 Venezuela
-
 Vietnam
-
 Yemen
Yemen
-
 Zambia
-
 Zimbabwe
- Forex
- Crypto
