
Microsoft stock trades down as cloud growth slowing moderates outlook

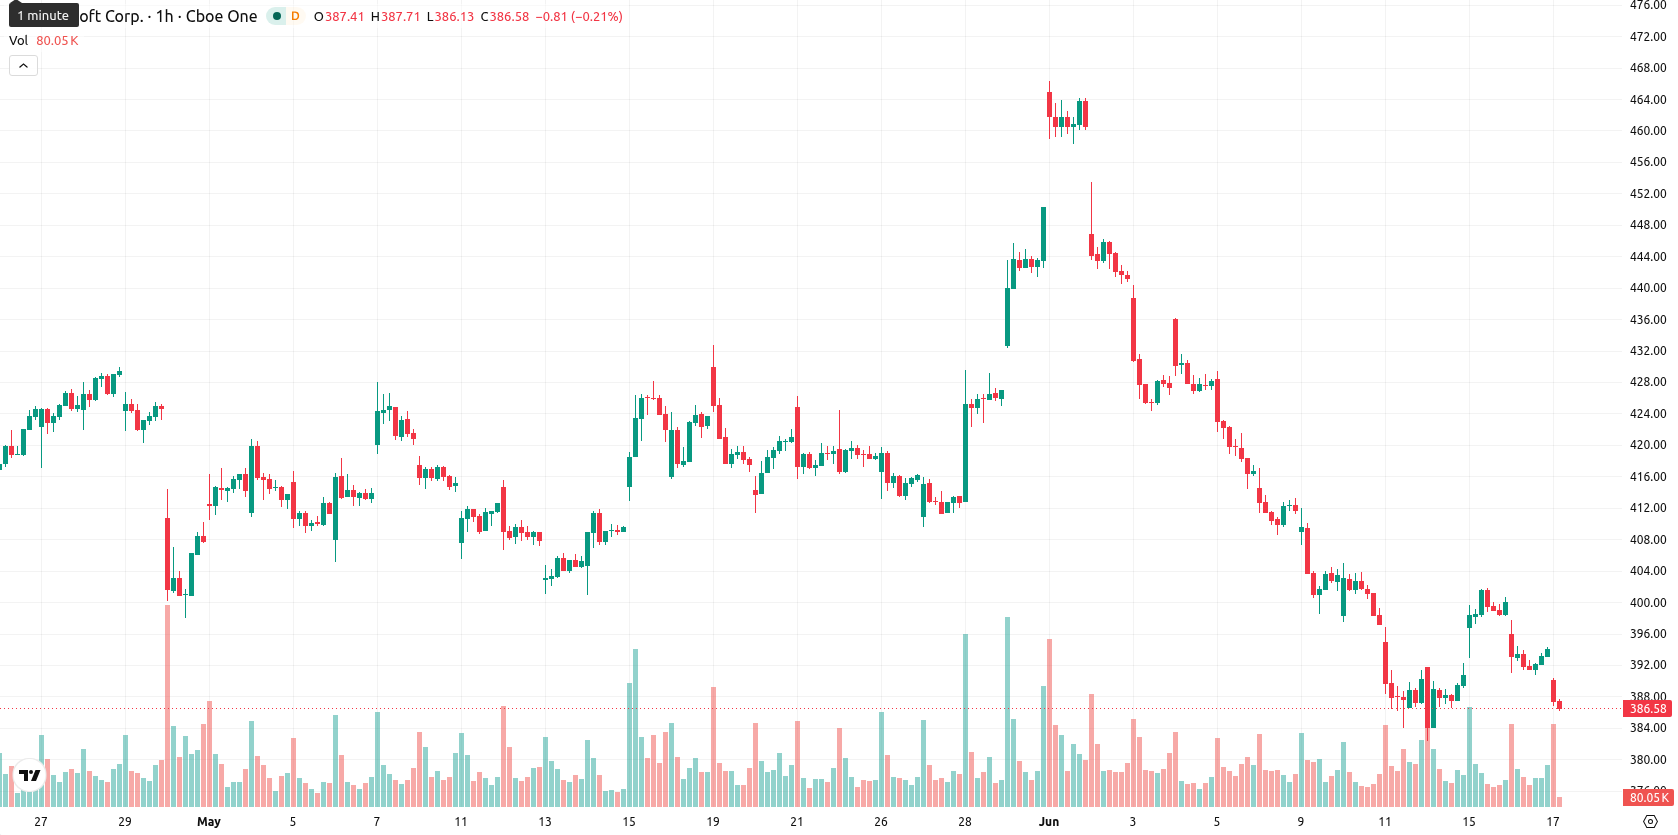
Microsoft Corporation (MSFT) stock is trading at $387.57, down 1.38% on the day. The price sits below its key moving averages, reflecting ongoing seller dominance in the short and medium terms.
Highlights
- Microsoft shares fell 10%, erasing about $357 billion in market value after Q2 earnings disappointed investors.
- Azure and cloud revenue grew 39%, meeting expectations but slowing from previous quarters, while capex surged 66% to $37.5 billion, pressuring near-term profitability.
- Technicals signal persistent downside: MSFT trades below key averages and momentum remains bearish, with a high probability of further declines toward $379.04–$396.10 in coming sessions.
Shareholder lawsuit and slowing growth dampen investor sentiment
Microsoft is dealing with a shareholder lawsuit filed in a Seattle federal court, following a 10% decline in its shares and the loss of approximately $357 billion in market value on January 29, 2026, after the release of its quarterly earnings. The company reported 39% revenue growth in its Azure and cloud segments for the recent quarter, meeting analyst expectations but marking a deceleration from the previous period, which has moderated investor enthusiasm. Additionally, second-quarter capital spending reached $37.5 billion, representing a nearly 66% increase year-over-year and exceeding expectations, which may introduce concerns over short-term profitability and cash flow.
Downside pressure reinforced as price breaches key technical levels
On the technical front, MSFT is currently trading below the MA-20 at $393.86 and the MA-50 at $396.80 on the working timeframe, and remains below the MA-200 at $452.57 on the daily chart. The immediate resistance is defined by the Ichimoku Kijun at $392.01. Momentum indicators show selling conditions: both MACD and ADX signal downside pressure, while RSI is at 45.74 (Sell). The Stoch RSI is oversold, indicating short-term exhaustion, and CCI is neutral. The Bull/Bear Power (BBP) indicator is also in oversold territory, underscoring persistent seller dominance during the session, while the Awesome Oscillator is neutral and does not shift the technical balance.
Downward bias prevails as resistance holds and volatility persists
Over the next 2–3 trading days, the expected price range for MSFT is $379.04 to $396.10, representing a typical volatility band relative to current levels. The probability of a near-term upward move is very low, while further downside remains highly likely and a reversal appears unlikely. A bullish scenario would require a breakout above resistance at $392.01 (Kijun), while a bearish case will be confirmed if price closes below support at $379.04.
Earlier, analysts noted that Microsoft's short-term outlook was pressured by slowing Azure growth rising capital expenditures tied to AI, and escalating legal risks, contributing to a bearish technical bias. The current setup reinforces these concerns as sustained seller dominance and heightened volatility persist, making $379.04 a key downside level for traders to monitor in the days ahead.


Latest Microsoft News


-
 Afghanistan
-
 Albania
-
 Algeria
-
 Angola
-
 Argentina
-
 Armenia
-
 Australia
-
 Austria
-
 Azerbaijan
-
 Bahamas
-
 Bahrain
-
 Bangladesh
-
 Belarus
-
 Belgium
-
 Bolivia
-
 Botswana
-
 Brazil
-
 Brunei
-
 Bulgaria
-
 Cambodia
-
 Cameroon
-
 Canada
-
 Chile
Chile
-
 China
China
-
 Colombia
-
 Congo
Congo
-
 Costa Rica
-
 Cote d'Ivoire
-
 Croatia
-
 Cuba
Cuba
-
 Cyprus
-
 Czechia
-
 DR Congo
-
 Denmark
-
 Dominican Republic
-
 Ecuador
-
 Egypt
Egypt
-
 El Salvador
-
 Estonia
-
 Eswatini
-
 Ethiopia
-
 Finland
-
 France
-
 Georgia
-
 Germany
-
 Ghana
Ghana
-
 Greece
-
 Haiti
Haiti
-
 Hong Kong
-
 Hungary
-
 India
India
-
 Indonesia
-
 Iran, Islamic republic
-
 Iraq
Iraq
-
 Ireland
-
 Israel
-
 Italy
Italy
-
 Jamaica
-
 Japan
Japan
-
 Jordan
-
 Kazakhstan
-
 Kenya
Kenya
-
 Korea
Korea
-
 Kuwait
-
 Kyrgyzstan
-
 Laos
Laos
-
 Latvia
-
 Lebanon
-
 Lesotho
-
 Libya
Libya
-
 Lithuania
-
 Luxembourg
-
 Madagascar
-
 Malaysia
-
 Malta
Malta
-
 Mauritius
-
 Mexico
-
 Moldova
-
 Mongolia
-
 Montenegro
-
 Morocco
-
 Mozambique
-
 Myanmar
-
 Namibia
-
 Nepal
Nepal
-
 Netherlands
-
 New Zealand
-
 Nigeria
-
 North Macedonia
-
 Norway
-
 Oman
Oman
-
 Pakistan
-
 Palestine
-
 Panama
-
 Papua New Guinea
-
 Paraguay
-
 Peru
Peru
-
 Philippines
-
 Poland
-
 Portugal
-
 Puerto Rico
-
 Qatar
Qatar
-
 Reunion
-
 Romania
-
 Rwanda
-
 Saudi Arabia
-
 Serbia
-
 Singapore
-
 Slovakia
-
 Slovenia
-
 Somalia
-
 South Africa
-
 Spain
Spain
-
 Sri Lanka
-
 Sweden
-
 Switzerland
-
 Syria
Syria
-
 Taiwan
-
 Tajikistan
-
 Tanzania
-
 Thailand
-
 Trinidad and Tobago
-
 Tunisia
-
 Turkey
-
 UAE
UAE
-
 Uganda
-
 Ukraine
-
 United Kingdom
-
United States
-
 Uruguay
-
 Uzbekistan
-
 Venezuela
-
 Vietnam
-
 Yemen
Yemen
-
 Zambia
-
 Zimbabwe
- Forex
- Crypto
