
+1.42% for Palantir stock as buyers dominate intraday trading

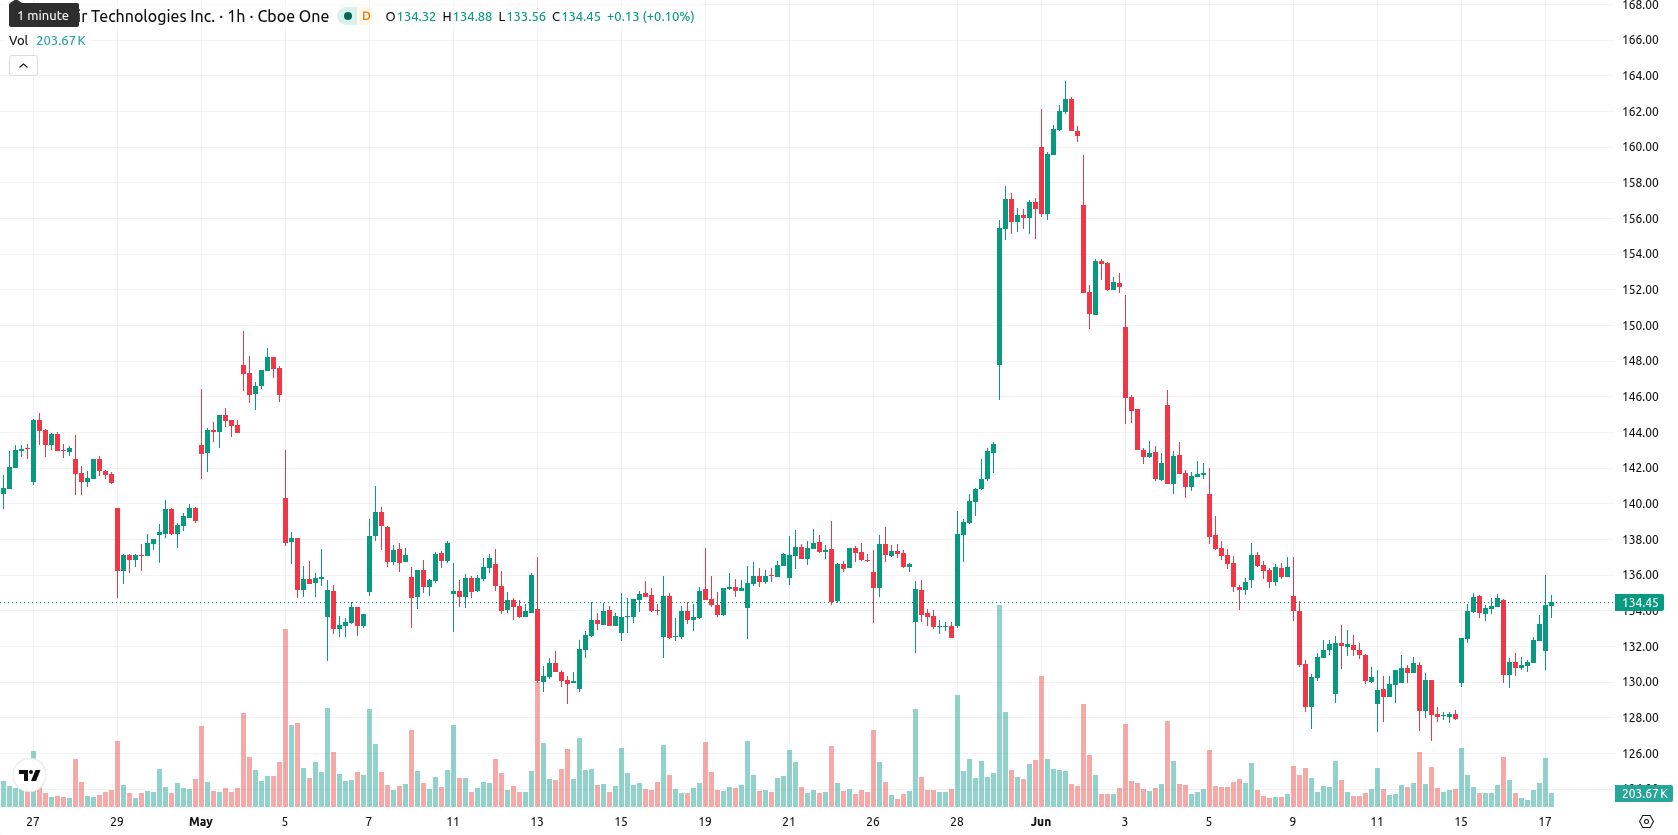
Palantir Technologies Inc. (PLTR) stock is trading at $134.55, up 1.42% on the day. The price currently sits above its short- and medium-term moving averages, indicating positive momentum, while longer-term resistance remains in place.
Highlights
- France's DGSI will replace Palantir's analytics software with ChapsVision, creating uncertainty over future European government revenue streams.
- Ongoing Swiss and UK contract reviews underscore increased regulatory and contract risk for Palantir in key European public sector markets.
- PLTR/USD momentum is mixed, but a modestly bullish bias persists with price expected to consolidate between $130.84 and $138.26 in the near term.
Contract risks intensify as European regulators shift procurement strategy
France's domestic intelligence agency DGSI will replace Palantir's analytics platforms with tools from ChapsVision, according to Reuters, though Palantir's contract remains fully in effect until the transition completes. This decision introduces uncertainty around future recurring revenue from a major European public sector client, but continued contract enforcement preserves near-term cash flows. Separately, Swiss authorities are also reconsidering agreements with Palantir amid concerns over data sovereignty following an unfavorable legal outcome, while the UK government is in the process of reviewing its £330 million NHS contract—developments that together highlight heightened regulatory and contract risk in key European government markets.
Momentum divergence emerges as technical levels guide direction
On the technical front, PLTR remains above its MA-20 and MA-50 on the hourly chart but has not managed to clear the MA-200 on the daily timeframe, with the Ichimoku Kijun level at $130.82 providing immediate support. Multiple momentum signals are sending mixed messages: the MACD supports upward momentum, but the ADX points to declining trend strength. The RSI sits at 53.57, typically a 'buy' indication, while Stoch RSI signals 'sell', CCI is neutral, and Bull/Bear Power reflects intraday buyer dominance. The Awesome Oscillator confirms alignment with the prevailing trend, but price action sits near today's low on subdued volatility, highlighting underlying market caution and notable momentum divergence.
Consolidation likely as volatility defines short-term trading band
In the short term, PLTR is expected to fluctuate between $130.84 and $138.26, a range consistent with typical volatility at current levels. With a 57% probability of upside, the baseline scenario points to consolidation within this band. A decisive break above resistance could trigger a rapid move toward the upper end, while a drop below the Kijun at $130.82 would likely lead to renewed selling targeting the lower boundary.
Earlier, analysts noted that Palantir faced persistent resistance and heightened strategic uncertainty due to evolving European regulatory and contract risks. The current setup adds new evidence of both technical momentum and deepening headline risk, positioning the $130.82 Kijun level as a key threshold for sustaining short-term upside within the prevailing $130.84–$138.26 range.


Latest Palantir News


-
 Afghanistan
-
 Albania
-
 Algeria
-
 Angola
-
 Argentina
-
 Armenia
-
 Australia
-
 Austria
-
 Azerbaijan
-
 Bahamas
-
 Bahrain
-
 Bangladesh
-
 Belarus
-
 Belgium
-
 Bolivia
-
 Botswana
-
 Brazil
-
 Brunei
-
 Bulgaria
-
 Cambodia
-
 Cameroon
-
 Canada
-
 Chile
Chile
-
 China
China
-
 Colombia
-
 Congo
Congo
-
 Costa Rica
-
 Cote d'Ivoire
-
 Croatia
-
 Cuba
Cuba
-
 Cyprus
-
 Czechia
-
 DR Congo
-
 Denmark
-
 Dominican Republic
-
 Ecuador
-
 Egypt
Egypt
-
 El Salvador
-
 Estonia
-
 Eswatini
-
 Ethiopia
-
 Finland
-
 France
-
 Georgia
-
 Germany
-
 Ghana
Ghana
-
 Greece
-
 Haiti
Haiti
-
 Hong Kong
-
 Hungary
-
 India
India
-
 Indonesia
-
 Iran, Islamic republic
-
 Iraq
Iraq
-
 Ireland
-
 Israel
-
 Italy
Italy
-
 Jamaica
-
 Japan
Japan
-
 Jordan
-
 Kazakhstan
-
 Kenya
Kenya
-
 Korea
Korea
-
 Kuwait
-
 Kyrgyzstan
-
 Laos
Laos
-
 Latvia
-
 Lebanon
-
 Lesotho
-
 Libya
Libya
-
 Lithuania
-
 Luxembourg
-
 Madagascar
-
 Malaysia
-
 Malta
Malta
-
 Mauritius
-
 Mexico
-
 Moldova
-
 Mongolia
-
 Montenegro
-
 Morocco
-
 Mozambique
-
 Myanmar
-
 Namibia
-
 Nepal
Nepal
-
 Netherlands
-
 New Zealand
-
 Nigeria
-
 North Macedonia
-
 Norway
-
 Oman
Oman
-
 Pakistan
-
 Palestine
-
 Panama
-
 Papua New Guinea
-
 Paraguay
-
 Peru
Peru
-
 Philippines
-
 Poland
-
 Portugal
-
 Puerto Rico
-
 Qatar
Qatar
-
 Reunion
-
 Romania
-
 Rwanda
-
 Saudi Arabia
-
 Serbia
-
 Singapore
-
 Slovakia
-
 Slovenia
-
 Somalia
-
 South Africa
-
 Spain
Spain
-
 Sri Lanka
-
 Sweden
-
 Switzerland
-
 Syria
Syria
-
 Taiwan
-
 Tajikistan
-
 Tanzania
-
 Thailand
-
 Trinidad and Tobago
-
 Tunisia
-
 Turkey
-
 UAE
UAE
-
 Uganda
-
 Ukraine
-
 United Kingdom
-
United States
-
 Uruguay
-
 Uzbekistan
-
 Venezuela
-
 Vietnam
-
 Yemen
Yemen
-
 Zambia
-
 Zimbabwe
- Forex
- Crypto
