
Steady price for Tesla stock as Canadian policy shift on Chinese imports emerges

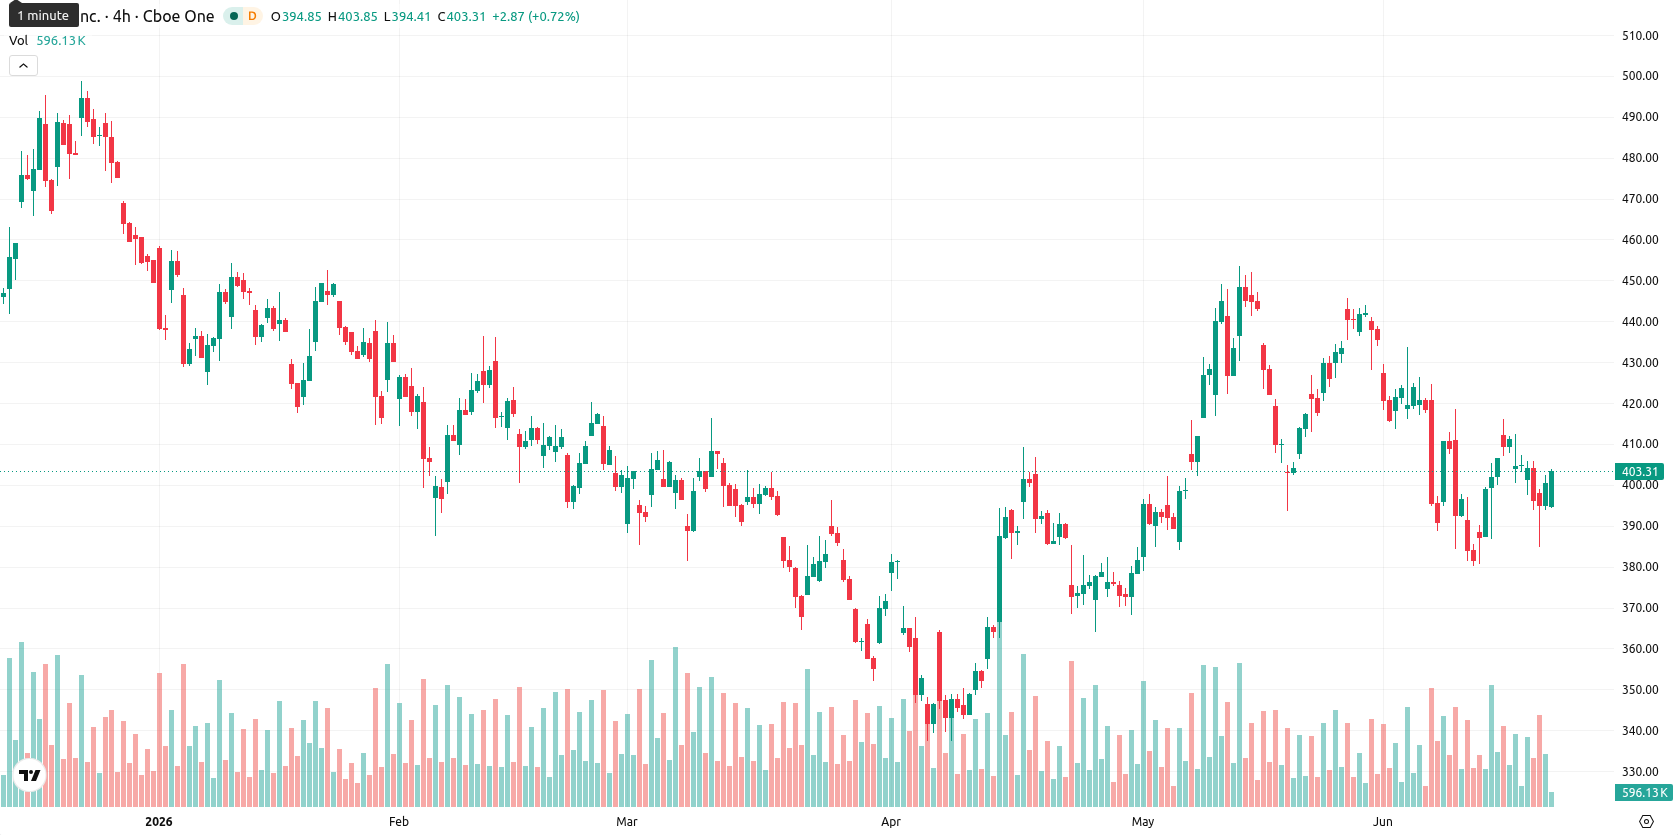
Tesla, Inc. (TSLA) stock is trading at $399.96, up 0.9% on the day after a volatile session that finished near the daily high. The stock currently sits above its short-term moving average, but continues to face resistance from longer-term averages.
Highlights
- Tesla faces significant earnings risk as Western tariffs, including 100% duties, restrict Model Y imports and increase costs in key markets.
- Canadian policy shifts and Tesla's ongoing reliance on Chinese-processed battery materials create added uncertainty and supply chain vulnerability for North American operations.
- Technicals indicate TSLA consolidating between $384.35 and $415.57, with bearish momentum and a 71% probability of a downward move near-term.
Regulatory pressures and supply chain risks weigh on Tesla's outlook
Tesla continues to face pressure from Western tariffs and restrictions on Chinese-made vehicles, with the imposition of 100% tariffs previously affecting 44,000 Model Y units imported by the company, according to Driving. This direct regulatory action constrains Tesla's ability to supply key models and could pressure earnings by raising input costs in major markets. Recent changes in Canadian policy introduce additional uncertainty to its import operations, heightening risk for North American sales pipelines. Meanwhile, Tesla's heavy dependence on battery material processing in China—especially for graphite—represents a persistent supply chain vulnerability, though ongoing initiatives to secure non-Chinese sources, as reported by Energydigital, aim to reduce future exposure.
Mixed technical signals as resistance holds and volatility intensifies
TSLA closed the session at $399.96 after gapping down $5.78 at the open, finishing near its daily high and exhibiting elevated volatility. The price remains above the MA-20 but continues to face resistance from the MA-50 and MA-200, while the Ichimoku Kijun at $406.88 serves as the closest technical ceiling. MACD signals a strong sell and ADX reflects a lack of trend direction, with RSI and AO both negative; however, Stoch RSI is positive in the short run, CCI is neutral, and BBP points to buyer dominance and overbought intraday conditions. Divergent oscillator signals capture weak momentum on one side and resilient intraday demand on the other.
Downside favored for TSLA as range narrows and breakout odds drop
Over the next 2–3 trading days, TSLA is likely to consolidate inside the $384.35 to $415.57 volatility band. The probability for an upward breakout is 29%, while a downside move is favored at 71%. Short-term bullish momentum would require a sustained move above $406.88, whereas a bearish breakdown would be confirmed on a drop below $384.35.
Earlier, analysts noted that Tesla faced heightened regulatory scrutiny and mixed technical signals, which raised the risk of further downside in the stock. The latest developments around tariffs, supply chain vulnerabilities, and shifting North American policy further intensify downside risk, making a sustained close above the technical ceiling at $406.88 or a breakdown below $384.35 critical levels for confirming any directional conviction in the near term.


Latest Tesla News


-
 Afghanistan
-
 Albania
-
 Algeria
-
 Angola
-
 Argentina
-
 Armenia
-
 Australia
-
 Austria
-
 Azerbaijan
-
 Bahamas
-
 Bahrain
-
 Bangladesh
-
 Belarus
-
 Belgium
-
 Bolivia
-
 Botswana
-
 Brazil
-
 Brunei
-
 Bulgaria
-
 Cambodia
-
 Cameroon
-
 Canada
-
 Chile
Chile
-
 China
China
-
 Colombia
-
 Congo
Congo
-
 Costa Rica
-
 Cote d'Ivoire
-
 Croatia
-
 Cuba
Cuba
-
 Cyprus
-
 Czechia
-
 DR Congo
-
 Denmark
-
 Dominican Republic
-
 Ecuador
-
 Egypt
Egypt
-
 El Salvador
-
 Estonia
-
 Eswatini
-
 Ethiopia
-
 Finland
-
 France
-
 Georgia
-
 Germany
-
 Ghana
Ghana
-
 Greece
-
 Haiti
Haiti
-
 Hong Kong
-
 Hungary
-
 India
India
-
 Indonesia
-
 Iran, Islamic republic
-
 Iraq
Iraq
-
 Ireland
-
 Israel
-
 Italy
Italy
-
 Jamaica
-
 Japan
Japan
-
 Jordan
-
 Kazakhstan
-
 Kenya
Kenya
-
 Korea
Korea
-
 Kuwait
-
 Kyrgyzstan
-
 Laos
Laos
-
 Latvia
-
 Lebanon
-
 Lesotho
-
 Libya
Libya
-
 Lithuania
-
 Luxembourg
-
 Madagascar
-
 Malaysia
-
 Malta
Malta
-
 Mauritius
-
 Mexico
-
 Moldova
-
 Mongolia
-
 Montenegro
-
 Morocco
-
 Mozambique
-
 Myanmar
-
 Namibia
-
 Nepal
Nepal
-
 Netherlands
-
 New Zealand
-
 Nigeria
-
 North Macedonia
-
 Norway
-
 Oman
Oman
-
 Pakistan
-
 Palestine
-
 Panama
-
 Papua New Guinea
-
 Paraguay
-
 Peru
Peru
-
 Philippines
-
 Poland
-
 Portugal
-
 Puerto Rico
-
 Qatar
Qatar
-
 Reunion
-
 Romania
-
 Rwanda
-
 Saudi Arabia
-
 Serbia
-
 Singapore
-
 Slovakia
-
 Slovenia
-
 Somalia
-
 South Africa
-
 Spain
Spain
-
 Sri Lanka
-
 Sweden
-
 Switzerland
-
 Syria
Syria
-
 Taiwan
-
 Tajikistan
-
 Tanzania
-
 Thailand
-
 Trinidad and Tobago
-
 Tunisia
-
 Turkey
-
 UAE
UAE
-
 Uganda
-
 Ukraine
-
 United Kingdom
-
United States
-
 Uruguay
-
 Uzbekistan
-
 Venezuela
-
 Vietnam
-
 Yemen
Yemen
-
 Zambia
-
 Zimbabwe
- Forex
- Crypto
