
$84.75B equity raise with buyback pause pushes Alphabet stock down 5.38%

Alphabet Inc. (GOOGL) stock is trading at $348.1, registering a daily decline of 5.38%. The price sits below its short and medium-term moving averages but remains positioned above its long-term average.
Highlights
- Alphabet raised $84.75 billion for AI infrastructure, pausing buybacks and triggering near-term equity dilution concerns.
- Robust operations are reflected in $402.84 billion annual revenue and a new strategic Google Cloud AI partnership with HSBC.
- GOOGL trades with bearish intraday tone beneath key averages; expected range is $341.72–$373.22 as overbought signals clash with short-term weakness.
Liquidity boost weighs on sentiment as buybacks pause and dilution rises
Alphabet Inc. completed an $84.75 billion capital raise to fund AI infrastructure, a move accompanied by a pause in share buyback programs and resulting in equity dilution, according to Tradingkey. The capital raise adds liquidity for future investments but reduces per-share value and eliminates near-term buyback support, weighing on sentiment. Alphabet also reported $402.84 billion in annual revenue, providing a strong operational base, and entered a multi-year AI partnership with HSBC through Google Cloud as reported by Finance Yahoo. These developments unfolded as investors evaluated the tradeoff between future growth initiatives and immediate shareholder returns.
Diverging indicator signals under technical pressure near session low
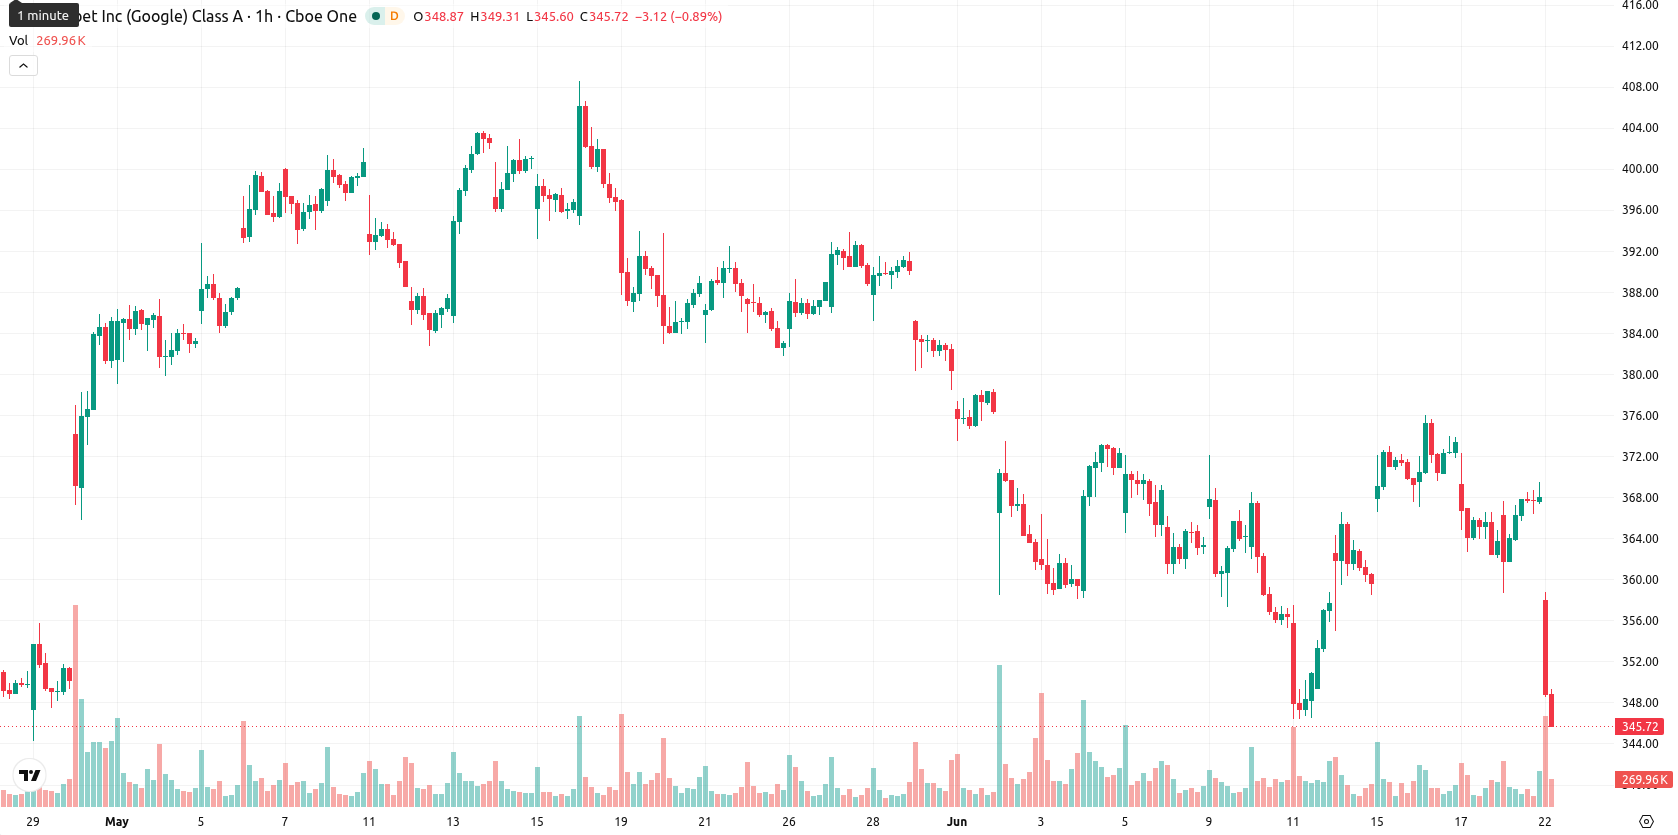
GOOGL is trading below the MA-20 ($367.64) and MA-50 ($363.44) levels on the H1 chart, suggesting ongoing short and medium-term technical pressure. Immediate resistance is defined by the Ichimoku Kijun level at $367.31, while the MA-200 at $311.08 forms major support. For oscillators, the RSI stands at 53.56 (buy signal), with MACD on a buy and the Awesome Oscillator signaling strong buy, though Stoch RSI, CCI, and BBP are all classified as overbought or neutral. The ADX remains neutral, indicating no clear trend dominance. This technical mix points to divergence, where some indicators favor continued upward momentum but overbought oscillators and the close near the session low suggest the risk of further intraday weakness.
Range-bound outlook amid high upside probability and pivotal resistance
For the next 2–3 trading days, GOOGL is likely to remain within a typical volatility band between $341.72 and $373.22. The baseline scenario is sideways movement within this range. A bullish outcome would require a breakout above $373.22 resistance, whereas a bearish scenario would be triggered by a decisive move below $341.72 support. The probability of an upward move in the short term is estimated at 68%, with a 32% chance of a downward move.
Earlier, analysts noted that Alphabet's ambitious AI investments and evolving business segments were driving long-term growth potential, although increasing capital expenditures remained a concern for margins. With the recent capital raise and strategic partnerships providing fresh liquidity but also introducing near-term equity dilution and technical pressure, traders should closely monitor the $373.22 resistance and $341.72 support as potential catalysts for the stock’s next directional move.


Latest Google News


-
 Afghanistan
-
 Albania
-
 Algeria
-
 Angola
-
 Argentina
-
 Armenia
-
 Australia
-
 Austria
-
 Azerbaijan
-
 Bahamas
-
 Bahrain
-
 Bangladesh
-
 Belarus
-
 Belgium
-
 Bolivia
-
 Botswana
-
 Brazil
-
 Brunei
-
 Bulgaria
-
 Cambodia
-
 Cameroon
-
 Canada
-
 Chile
Chile
-
 China
China
-
 Colombia
-
 Congo
Congo
-
 Costa Rica
-
 Cote d'Ivoire
-
 Croatia
-
 Cuba
Cuba
-
 Cyprus
-
 Czechia
-
 DR Congo
-
 Denmark
-
 Dominican Republic
-
 Ecuador
-
 Egypt
Egypt
-
 El Salvador
-
 Estonia
-
 Eswatini
-
 Ethiopia
-
 Finland
-
 France
-
 Georgia
-
 Germany
-
 Ghana
Ghana
-
 Greece
-
 Haiti
Haiti
-
 Hong Kong
-
 Hungary
-
 India
India
-
 Indonesia
-
 Iran, Islamic republic
-
 Iraq
Iraq
-
 Ireland
-
 Israel
-
 Italy
Italy
-
 Jamaica
-
 Japan
Japan
-
 Jordan
-
 Kazakhstan
-
 Kenya
Kenya
-
 Korea
Korea
-
 Kuwait
-
 Kyrgyzstan
-
 Laos
Laos
-
 Latvia
-
 Lebanon
-
 Lesotho
-
 Libya
Libya
-
 Lithuania
-
 Luxembourg
-
 Madagascar
-
 Malaysia
-
 Malta
Malta
-
 Mauritius
-
 Mexico
-
 Moldova
-
 Mongolia
-
 Montenegro
-
 Morocco
-
 Mozambique
-
 Myanmar
-
 Namibia
-
 Nepal
Nepal
-
 Netherlands
-
 New Zealand
-
 Nigeria
-
 North Macedonia
-
 Norway
-
 Oman
Oman
-
 Pakistan
-
 Palestine
-
 Panama
-
 Papua New Guinea
-
 Paraguay
-
 Peru
Peru
-
 Philippines
-
 Poland
-
 Portugal
-
 Puerto Rico
-
 Qatar
Qatar
-
 Reunion
-
 Romania
-
 Rwanda
-
 Saudi Arabia
-
 Serbia
-
 Singapore
-
 Slovakia
-
 Slovenia
-
 Somalia
-
 South Africa
-
 Spain
Spain
-
 Sri Lanka
-
 Sweden
-
 Switzerland
-
 Syria
Syria
-
 Taiwan
-
 Tajikistan
-
 Tanzania
-
 Thailand
-
 Trinidad and Tobago
-
 Tunisia
-
 Turkey
-
 UAE
UAE
-
 Uganda
-
 Ukraine
-
 United Kingdom
-
United States
-
 Uruguay
-
 Uzbekistan
-
 Venezuela
-
 Vietnam
-
 Yemen
Yemen
-
 Zambia
-
 Zimbabwe
- Forex
- Crypto
