
+1.40% for AMD stock as limited upside signals emerge near overbought levels

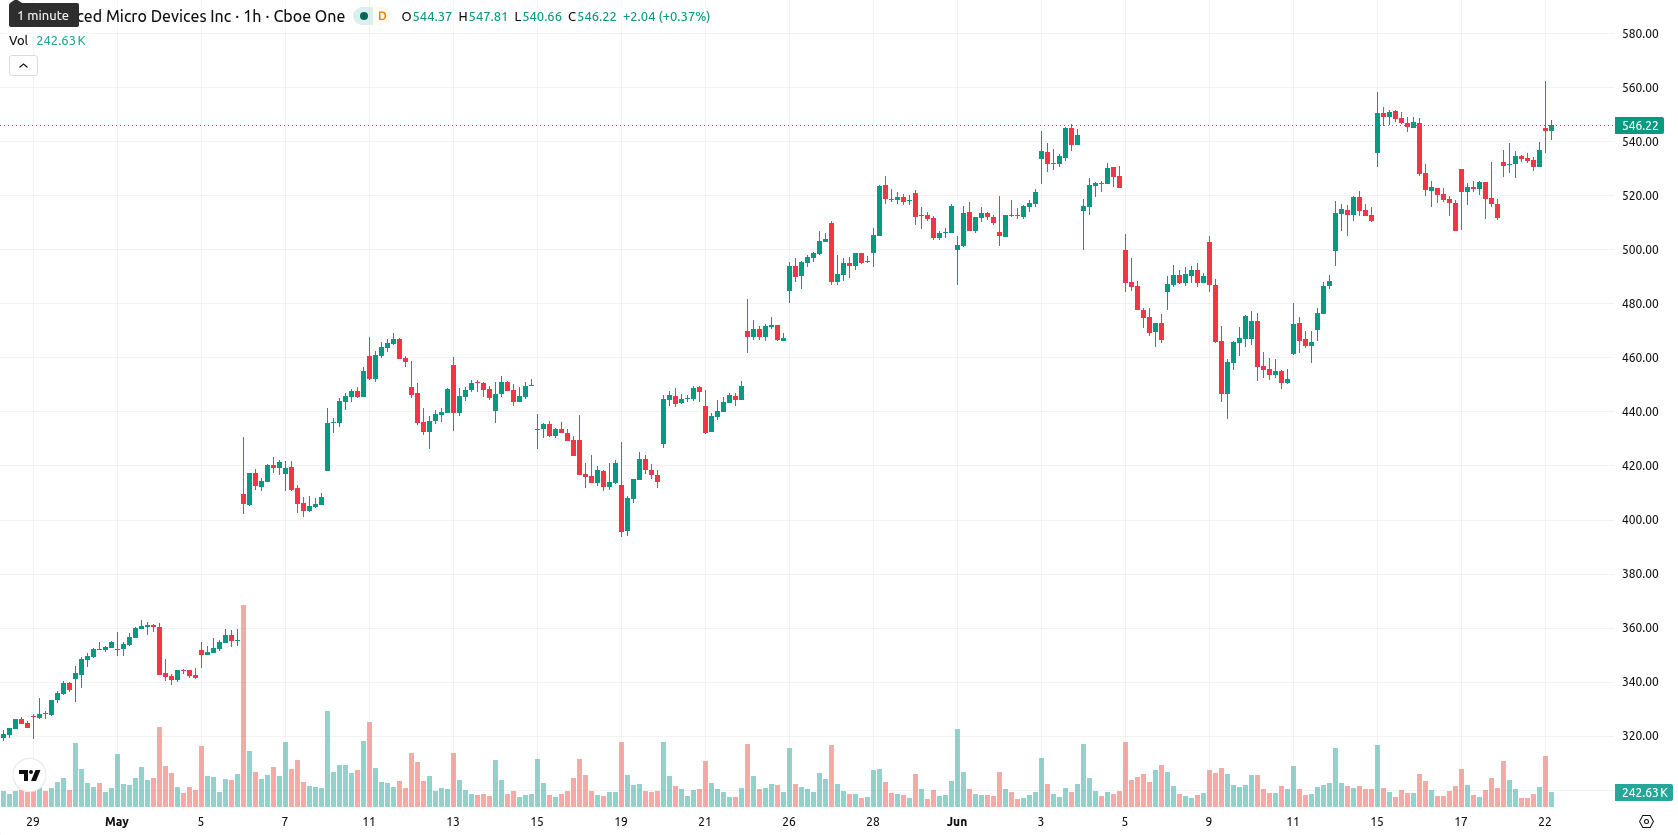
Advanced Micro Devices, Inc. (AMD) stock is trading at $544.57, up 1.4% today. The price sits above its key moving averages, indicating short-term and medium-term strength relative to recent trends.
Highlights
- AMD/USD displays robust bullish momentum, trading well above key moving averages and its long-term trend support.
- Short-term and medium-term technicals are strongly positive, but momentum oscillators warn of overbought conditions and risk of a pullback.
- Expected price range over 2–3 days is $525.92 to $563.22, with a high probability of sideways to bullish consolidation unless key support fails.
Strong momentum signals amid overbought warnings on oscillators
On the H1 chart, AMD is above the MA-20 at $523.31 and MA-50 at $510.71, while the daily MA-200 is far below at $261.13. The Ichimoku Kijun support is close by at $528.86, serving as a near-term pivot. Momentum indicators are strong: both MACD and ADX signal Buy, and RSI is at 60.93. However, Stoch RSI, CCI, and BBP flag overbought conditions, and AO is neutral, pointing to divergence between trend strength and oscillator caution.
Bullish bias persists as breakout risk outweighs downside
In the next two to three trading days, AMD is expected to remain within a range of $525.92 to $563.22, reflecting typical volatility based on recent price action. The probability of an upward extension is very high, while risk of a decisive decline is currently low. A bullish breakout could occur if resistance within this band is surpassed, while loss of support at the Kijun level would shift attention to downside scenario management.
Previously it was reported that AMD exhibited strong bullish momentum with technical signals favoring continued upside. With fresh momentum readings and resilient price action above key moving averages, traders should monitor for a potential range expansion above $563.22 or renewed volatility if support at $528.86 is breached.


Latest AMD News


-
 Afghanistan
-
 Albania
-
 Algeria
-
 Angola
-
 Argentina
-
 Armenia
-
 Australia
-
 Austria
-
 Azerbaijan
-
 Bahamas
-
 Bahrain
-
 Bangladesh
-
 Belarus
-
 Belgium
-
 Bolivia
-
 Botswana
-
 Brazil
-
 Brunei
-
 Bulgaria
-
 Cambodia
-
 Cameroon
-
 Canada
-
 Chile
Chile
-
 China
China
-
 Colombia
-
 Congo
Congo
-
 Costa Rica
-
 Cote d'Ivoire
-
 Croatia
-
 Cuba
Cuba
-
 Cyprus
-
 Czechia
-
 DR Congo
-
 Denmark
-
 Dominican Republic
-
 Ecuador
-
 Egypt
Egypt
-
 El Salvador
-
 Estonia
-
 Eswatini
-
 Ethiopia
-
 Finland
-
 France
-
 Georgia
-
 Germany
-
 Ghana
Ghana
-
 Greece
-
 Haiti
Haiti
-
 Hong Kong
-
 Hungary
-
 India
India
-
 Indonesia
-
 Iran, Islamic republic
-
 Iraq
Iraq
-
 Ireland
-
 Israel
-
 Italy
Italy
-
 Jamaica
-
 Japan
Japan
-
 Jordan
-
 Kazakhstan
-
 Kenya
Kenya
-
 Korea
Korea
-
 Kuwait
-
 Kyrgyzstan
-
 Laos
Laos
-
 Latvia
-
 Lebanon
-
 Lesotho
-
 Libya
Libya
-
 Lithuania
-
 Luxembourg
-
 Madagascar
-
 Malaysia
-
 Malta
Malta
-
 Mauritius
-
 Mexico
-
 Moldova
-
 Mongolia
-
 Montenegro
-
 Morocco
-
 Mozambique
-
 Myanmar
-
 Namibia
-
 Nepal
Nepal
-
 Netherlands
-
 New Zealand
-
 Nigeria
-
 North Macedonia
-
 Norway
-
 Oman
Oman
-
 Pakistan
-
 Palestine
-
 Panama
-
 Papua New Guinea
-
 Paraguay
-
 Peru
Peru
-
 Philippines
-
 Poland
-
 Portugal
-
 Puerto Rico
-
 Qatar
Qatar
-
 Reunion
-
 Romania
-
 Rwanda
-
 Saudi Arabia
-
 Serbia
-
 Singapore
-
 Slovakia
-
 Slovenia
-
 Somalia
-
 South Africa
-
 Spain
Spain
-
 Sri Lanka
-
 Sweden
-
 Switzerland
-
 Syria
Syria
-
 Taiwan
-
 Tajikistan
-
 Tanzania
-
 Thailand
-
 Trinidad and Tobago
-
 Tunisia
-
 Turkey
-
 UAE
UAE
-
 Uganda
-
 Ukraine
-
 United Kingdom
-
United States
-
 Uruguay
-
 Uzbekistan
-
 Venezuela
-
 Vietnam
-
 Yemen
Yemen
-
 Zambia
-
 Zimbabwe
- Forex
- Crypto
