
Bitcoin liquidation to meet capital needs weighs MSTR stock down 1.77%

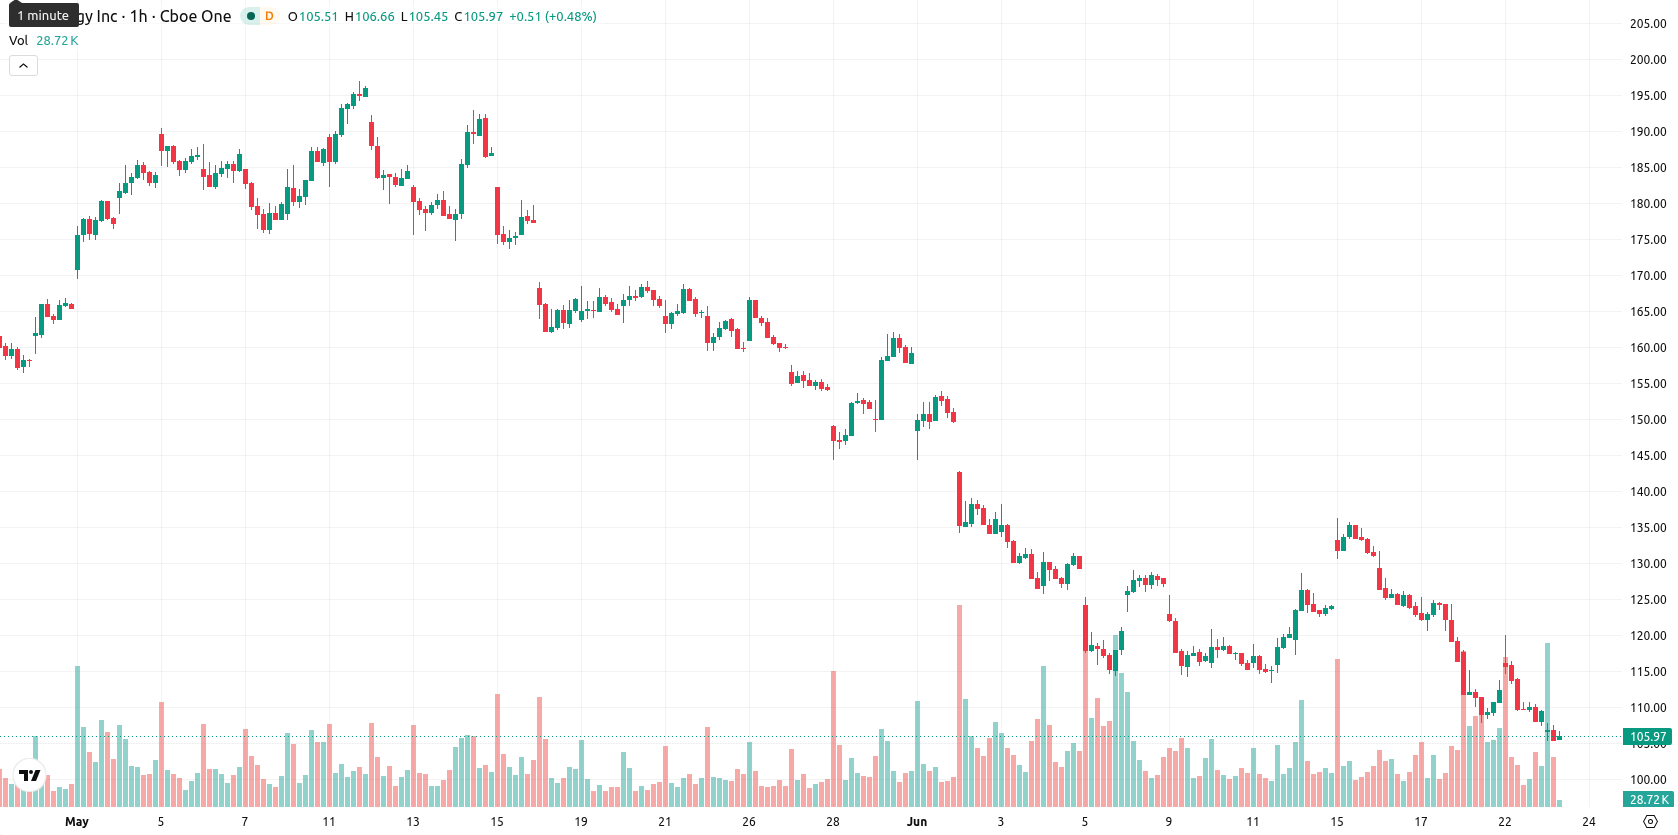
Strategy Incorporated (MSTR, formerly MicroStrategy) stock is trading at $107.52, down 1.77% for the session. The price currently sits below its key moving averages, indicating continued short-term selling momentum.
Highlights
- Strategy Inc. raised $335.5 million from selling 2.71 million MSTR shares to enhance cash reserves and meet financing needs.
- Nearly $300 million was allocated to U.S. dollar reserves for preferred dividend payments and debt servicing, while ongoing Bitcoin transactions support liquidity management.
- MSTR trades below key moving averages with technical indicators signaling persistent bearish momentum, likely keeping price within a $99.50–$115.54 range short term.
Liquidity strategy shifts as share sale and bitcoin moves fund debt
Strategy Inc. completed a significant sale of 2.71 million MSTR shares, raising $335.5 million in net proceeds to bolster cash reserves and support ongoing financing needs, according to Crypto. Nearly $300 million of those funds were directed to the company’s U.S. dollar reserve to meet STRC perpetual preferred stock dividend commitments and service outstanding debt, maintaining financial stability. The same week, Strategy acquired 520 Bitcoin for approximately $35 million, as reported by Bitcoinmagazine, and monetized 32 BTC in late May to fund preferred stock dividend obligations, highlighting the company’s ongoing reliance on both equity and digital assets to manage liquidity and capital structure.
Sustained downside bias as technical barriers and momentum align
On the H1 chart, MSTR is trading below the MA-20 at $113.49 and MA-50 at $120.17, while on the daily timeframe it remains under the MA-200 at $190.73. Immediate resistance is marked by the Ichimoku Kijun at $115.97. Momentum indicators further define the setup, with MACD on Sell, ADX at Neutral, RSI at 34.5 (Sell), and both Stoch RSI and Commodity Channel Index signaling oversold conditions. Bull/Bear Power also indicates ongoing seller dominance, and the Awesome Oscillator confirms the prevailing downside bias.
Probability of further decline rises amid narrow recovery prospects
Over the next 2–3 trading days, the typical volatility band is expected to range from $99.50 to $115.54. The likelihood of an upward move is considered very low, while a downward move carries a very high probability. Baseline expectations are for price to consolidate between these levels. Should the price break above $115.97, a short-term recovery could be signaled, while a move below $99.50 may trigger further downside acceleration.
Earlier, analysts noted that Strategy’s ongoing bitcoin accumulation and equity funding maneuvers could represent both a strategic strength and an operational vulnerability, particularly given persistent downside momentum. Fresh share sales and newly executed bitcoin transactions reinforce these themes, making the next decisive move outside the $99.50–$115.54 range an important indicator for a potential directional shift.


-
 Afghanistan
-
 Albania
-
 Algeria
-
 Angola
-
 Argentina
-
 Armenia
-
 Australia
-
 Austria
-
 Azerbaijan
-
 Bahamas
-
 Bahrain
-
 Bangladesh
-
 Belarus
-
 Belgium
-
 Bolivia
-
 Botswana
-
 Brazil
-
 Brunei
-
 Bulgaria
-
 Cambodia
-
 Cameroon
-
 Canada
-
 Chile
Chile
-
 China
China
-
 Colombia
-
 Congo
Congo
-
 Costa Rica
-
 Cote d'Ivoire
-
 Croatia
-
 Cuba
Cuba
-
 Cyprus
-
 Czechia
-
 DR Congo
-
 Denmark
-
 Dominican Republic
-
 Ecuador
-
 Egypt
Egypt
-
 El Salvador
-
 Estonia
-
 Eswatini
-
 Ethiopia
-
 Finland
-
 France
-
 Georgia
-
 Germany
-
 Ghana
Ghana
-
 Greece
-
 Haiti
Haiti
-
 Hong Kong
-
 Hungary
-
 India
India
-
 Indonesia
-
 Iran, Islamic republic
-
 Iraq
Iraq
-
 Ireland
-
 Israel
-
 Italy
Italy
-
 Jamaica
-
 Japan
Japan
-
 Jordan
-
 Kazakhstan
-
 Kenya
Kenya
-
 Korea
Korea
-
 Kuwait
-
 Kyrgyzstan
-
 Laos
Laos
-
 Latvia
-
 Lebanon
-
 Lesotho
-
 Libya
Libya
-
 Lithuania
-
 Luxembourg
-
 Madagascar
-
 Malaysia
-
 Malta
Malta
-
 Mauritius
-
 Mexico
-
 Moldova
-
 Mongolia
-
 Montenegro
-
 Morocco
-
 Mozambique
-
 Myanmar
-
 Namibia
-
 Nepal
Nepal
-
 Netherlands
-
 New Zealand
-
 Nigeria
-
 North Macedonia
-
 Norway
-
 Oman
Oman
-
 Pakistan
-
 Palestine
-
 Panama
-
 Papua New Guinea
-
 Paraguay
-
 Peru
Peru
-
 Philippines
-
 Poland
-
 Portugal
-
 Puerto Rico
-
 Qatar
Qatar
-
 Reunion
-
 Romania
-
 Rwanda
-
 Saudi Arabia
-
 Serbia
-
 Singapore
-
 Slovakia
-
 Slovenia
-
 Somalia
-
 South Africa
-
 Spain
Spain
-
 Sri Lanka
-
 Sweden
-
 Switzerland
-
 Syria
Syria
-
 Taiwan
-
 Tajikistan
-
 Tanzania
-
 Thailand
-
 Trinidad and Tobago
-
 Tunisia
-
 Turkey
-
 UAE
UAE
-
 Uganda
-
 Ukraine
-
 United Kingdom
-
United States
-
 Uruguay
-
 Uzbekistan
-
 Venezuela
-
 Vietnam
-
 Yemen
Yemen
-
 Zambia
-
 Zimbabwe
- Forex
- Crypto
