
Seller exhaustion limits Campbell’s stock rise amid resistance near $21.21

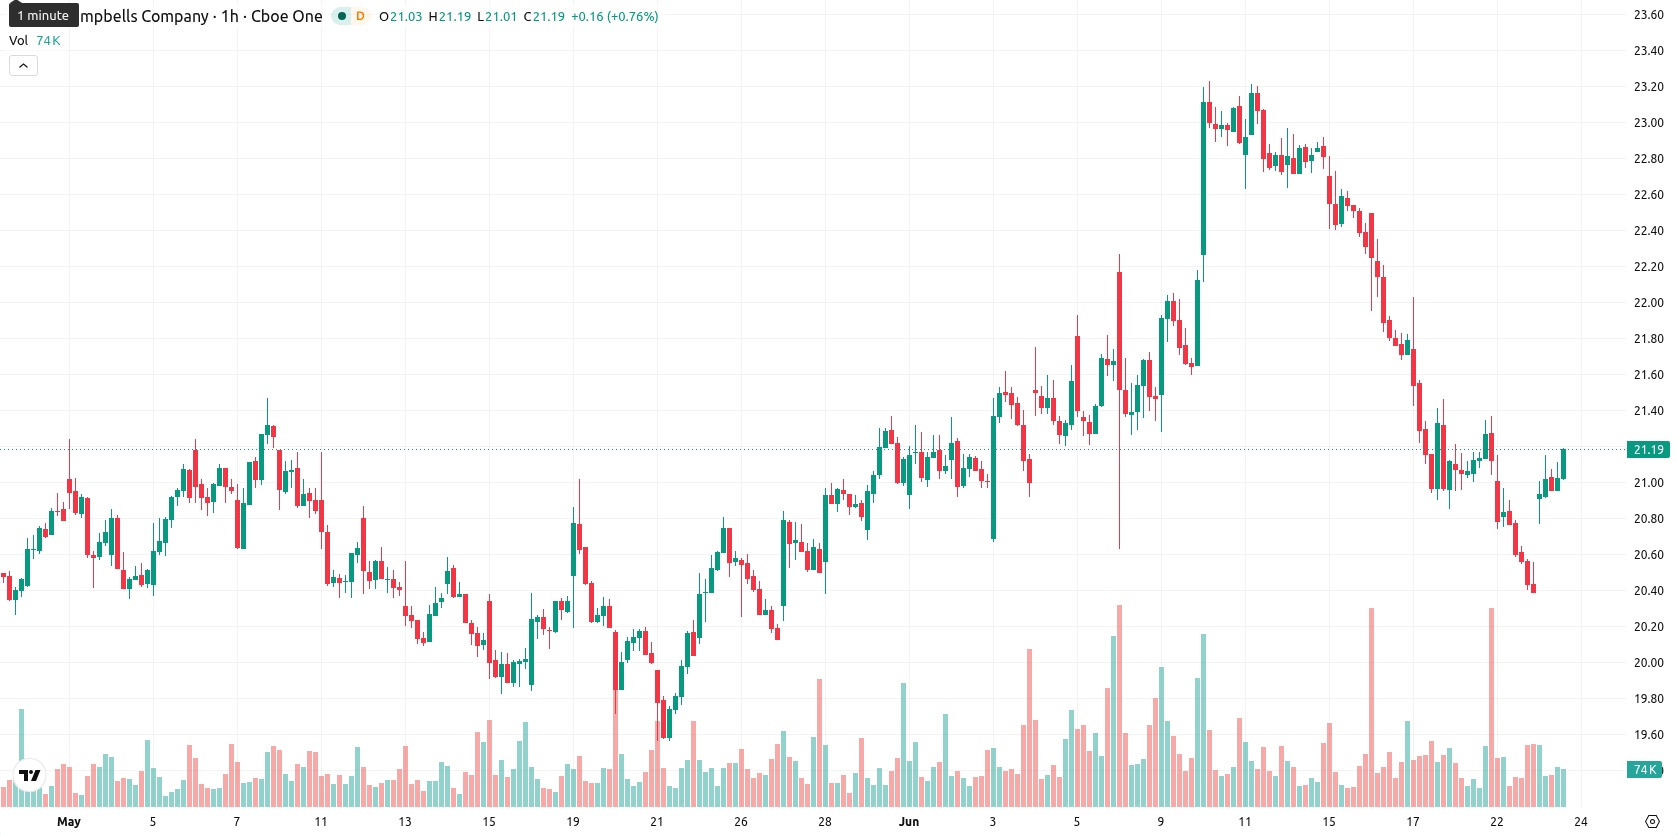
Campbell Soup Company (CPB) stock is trading at $21, up 2.94% on the day and showing a moderate intraday gain. The price currently sits between its short- and long-term moving averages on the working and daily timeframes, reflecting a complex technical landscape.
Highlights
- CPB/USD shows short-term support but remains under medium- and long-term selling pressure, signaling a weak overall technical structure.
- Momentum and oscillator indicators reflect a predominantly bearish bias with some short-term buyer exhaustion and mixed signals.
- Price is expected to consolidate between $20.26 and $21.74 over the next 2–3 days, with a 60% probability of downside.
Technical resistance and mixed momentum signals shape outlook
On the technical front, CPB is trading above its MA-20 moving average at $20.93, but remains below the MA-50 at $21.81 (working timeframe) and the MA-200 at $26.47 (daily chart). The Ichimoku Kijun sits at $21.21, serving as immediate resistance. Momentum indicators reveal a weak to bearish backdrop: the MACD signals Strong Sell, ADX reads Sell, and the RSI is at 45.22 (Sell). Meanwhile, the Stoch RSI shows overbought conditions, suggesting short-term exhaustion. The CCI and Awesome Oscillator are neutral, while BBP highlights intraday buyer dominance, contributing to mixed signals and underscoring the absence of a clear trend direction.
Bearish tilt prevails as price faces consolidation risks
Looking ahead over the next 2–3 trading days, the expected price range for CPB is $20.26–$21.74, a typical volatility band relative to current levels. The probability of an upward move is moderate at 40%, while a downward move carries a 60% likelihood. The baseline scenario anticipates consolidation within this corridor; a bullish outcome would require a break above the immediate resistance at $21.21, while a bearish scenario could see the price slip below $20.26.


-
 Afghanistan
-
 Albania
-
 Algeria
-
 Angola
-
 Argentina
-
 Armenia
-
 Australia
-
 Austria
-
 Azerbaijan
-
 Bahamas
-
 Bahrain
-
 Bangladesh
-
 Belarus
-
 Belgium
-
 Bolivia
-
 Botswana
-
 Brazil
-
 Brunei
-
 Bulgaria
-
 Cambodia
-
 Cameroon
-
 Canada
-
 Chile
Chile
-
 China
China
-
 Colombia
-
 Congo
Congo
-
 Costa Rica
-
 Cote d'Ivoire
-
 Croatia
-
 Cuba
Cuba
-
 Cyprus
-
 Czechia
-
 DR Congo
-
 Denmark
-
 Dominican Republic
-
 Ecuador
-
 Egypt
Egypt
-
 El Salvador
-
 Estonia
-
 Eswatini
-
 Ethiopia
-
 Finland
-
 France
-
 Georgia
-
 Germany
-
 Ghana
Ghana
-
 Greece
-
 Haiti
Haiti
-
 Hong Kong
-
 Hungary
-
 India
India
-
 Indonesia
-
 Iran, Islamic republic
-
 Iraq
Iraq
-
 Ireland
-
 Israel
-
 Italy
Italy
-
 Jamaica
-
 Japan
Japan
-
 Jordan
-
 Kazakhstan
-
 Kenya
Kenya
-
 Korea
Korea
-
 Kuwait
-
 Kyrgyzstan
-
 Laos
Laos
-
 Latvia
-
 Lebanon
-
 Lesotho
-
 Libya
Libya
-
 Lithuania
-
 Luxembourg
-
 Madagascar
-
 Malaysia
-
 Malta
Malta
-
 Mauritius
-
 Mexico
-
 Moldova
-
 Mongolia
-
 Montenegro
-
 Morocco
-
 Mozambique
-
 Myanmar
-
 Namibia
-
 Nepal
Nepal
-
 Netherlands
-
 New Zealand
-
 Nigeria
-
 North Macedonia
-
 Norway
-
 Oman
Oman
-
 Pakistan
-
 Palestine
-
 Panama
-
 Papua New Guinea
-
 Paraguay
-
 Peru
Peru
-
 Philippines
-
 Poland
-
 Portugal
-
 Puerto Rico
-
 Qatar
Qatar
-
 Reunion
-
 Romania
-
 Rwanda
-
 Saudi Arabia
-
 Serbia
-
 Singapore
-
 Slovakia
-
 Slovenia
-
 Somalia
-
 South Africa
-
 Spain
Spain
-
 Sri Lanka
-
 Sweden
-
 Switzerland
-
 Syria
Syria
-
 Taiwan
-
 Tajikistan
-
 Tanzania
-
 Thailand
-
 Trinidad and Tobago
-
 Tunisia
-
 Turkey
-
 UAE
UAE
-
 Uganda
-
 Ukraine
-
 United Kingdom
-
United States
-
 Uruguay
-
 Uzbekistan
-
 Venezuela
-
 Vietnam
-
 Yemen
Yemen
-
 Zambia
-
 Zimbabwe
- Forex
- Crypto
