
Nvidia shares weakening as RSI transitions to neutral-bullish territory: weekly review

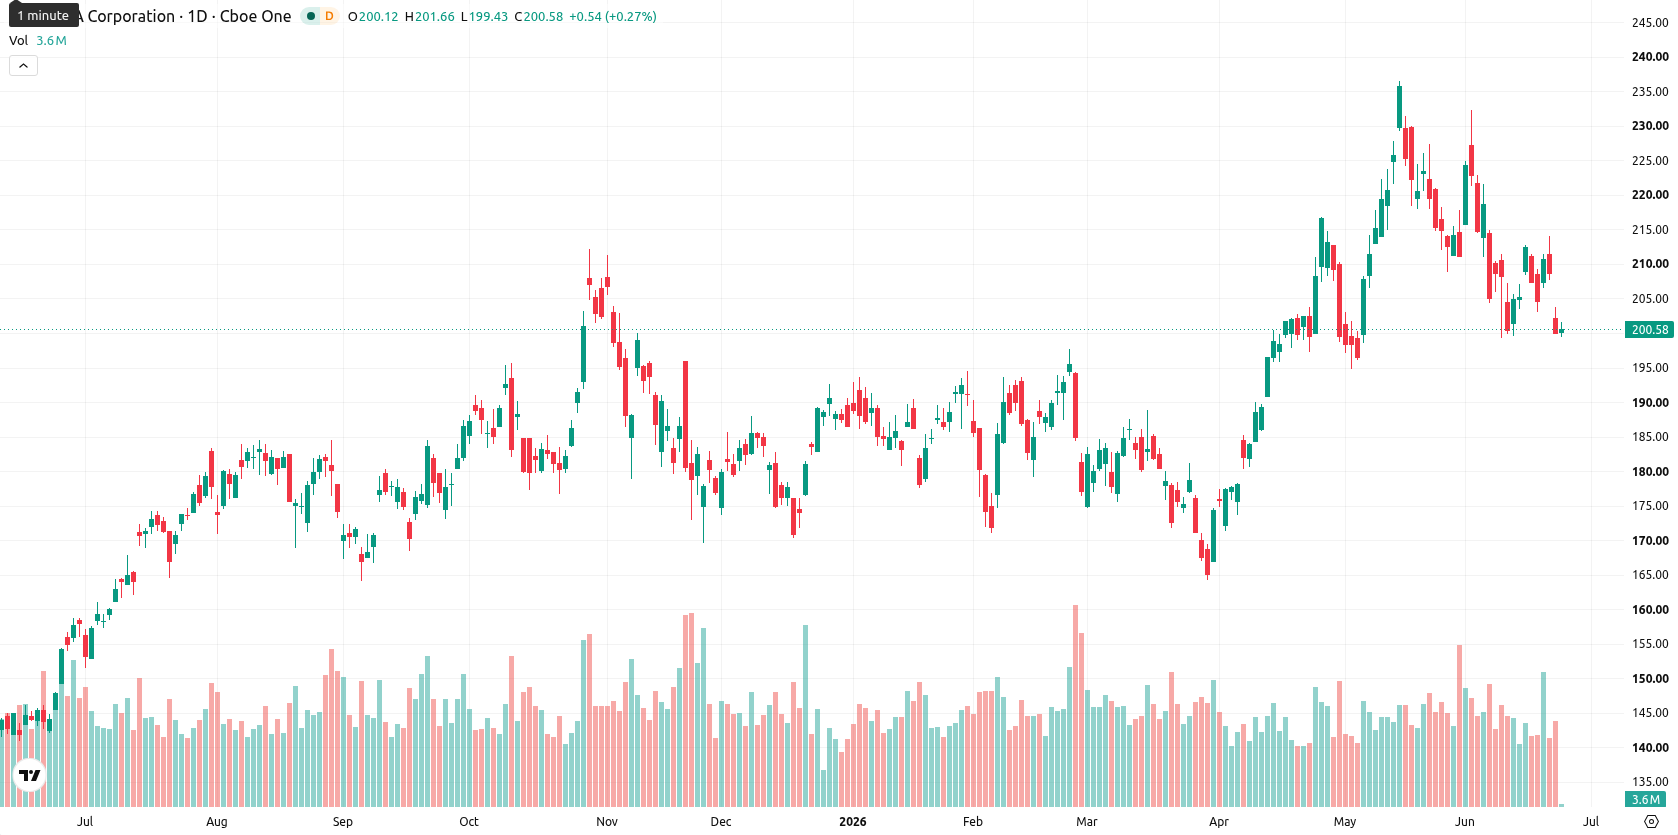
Nvidia Corporation (NVDA) is currently trading at $200.31, having fallen $10.05 or 4.49% over the last week. The asset remains just above its weekly MA-20 at $195.53 and significantly higher than its MA-50 at $187.50 and MA-200 at $103.90, indicating ongoing medium- and long-term bullish support despite recent pressure.
Highlights
- Nvidia is trading near strong medium- and long-term technical support with a bullish structural bias indicated by major averages.
- Despite bullish momentum from MACD and ADX, short-term oscillators flag fading strength and an overbought condition after a 4.49% weekly pullback.
- Price is expected to oscillate between $188.00 support and $212.00 resistance, with a 75% probability of an upward move next week.
AI product launches and insider selling shape sentiment this week
Nvidia has continued its expansion in advanced computing by launching the Vera Rubin supercomputing platform for AI and high-performance computing applications and introducing the BioNeMo Agent Toolkit, which supports life sciences research through industry adoption. The company also announced new partnerships in South Korea focused on securing memory chip supplies to advance its AI strategy. Additionally, Director Mark A Stevens sold 885,000 shares valued at approximately $186 million, while maintaining considerable holdings within the company.
Mixed momentum as price tests range support and bullish trend persists
On the weekly chart, Nvidia remains above key moving averages with the MA-20 providing near-term dynamic support at $195.53, while MA-50 at $187.50 and MA-200 at $103.90 confirm underlying bullish structure. Recent weekly action saw price move to the bottom of its range, hovering near support amid 6.99% volatility. Weekly indicators show mixed momentum: the MACD is bullish and ADX signals a positive trend, but oscillators like Stochastic RSI and CCI reflect waning strength, and RSI has moved into neutral-bullish territory. Bull/Bear Power is indicating overbought conditions, aligning with increased buyer pressure despite the recent decline.
Sideways bias and breakout risk as indicators favor further upside
For the next 5 trading days, Nvidia is expected to fluctuate between $188.00 and $212.00, mirroring current weekly volatility. Based on W1 indicators, there is a 75% probability the price will move higher against a 25% chance of further decline, given 3 of 4 major momentum signals remain on Buy or Strong Buy. The baseline scenario calls for sideways movement between the established support and resistance. Should Nvidia break above $212.00, upside potential could be renewed, while a drop below $188.00 may prompt additional downside pressure.
Earlier, analysts noted that Nvidia's stock remained vulnerable to sector-wide volatility and increased profit-taking following an extended rally. With recent technicals indicating lingering overbought conditions alongside ongoing innovation and strategic partnerships, traders should closely monitor shifts in weekly momentum for an early signal of a decisive breakout or deeper correction.


-
 Afghanistan
-
 Albania
-
 Algeria
-
 Angola
-
 Argentina
-
 Armenia
-
 Australia
-
 Austria
-
 Azerbaijan
-
 Bahamas
-
 Bahrain
-
 Bangladesh
-
 Belarus
-
 Belgium
-
 Bolivia
-
 Botswana
-
 Brazil
-
 Brunei
-
 Bulgaria
-
 Cambodia
-
 Cameroon
-
 Canada
-
 Chile
Chile
-
 China
China
-
 Colombia
-
 Congo
Congo
-
 Costa Rica
-
 Cote d'Ivoire
-
 Croatia
-
 Cuba
Cuba
-
 Cyprus
-
 Czechia
-
 DR Congo
-
 Denmark
-
 Dominican Republic
-
 Ecuador
-
 Egypt
Egypt
-
 El Salvador
-
 Estonia
-
 Eswatini
-
 Ethiopia
-
 Finland
-
 France
-
 Georgia
-
 Germany
-
 Ghana
Ghana
-
 Greece
-
 Haiti
Haiti
-
 Hong Kong
-
 Hungary
-
 India
India
-
 Indonesia
-
 Iran, Islamic republic
-
 Iraq
Iraq
-
 Ireland
-
 Israel
-
 Italy
Italy
-
 Jamaica
-
 Japan
Japan
-
 Jordan
-
 Kazakhstan
-
 Kenya
Kenya
-
 Korea
Korea
-
 Kuwait
-
 Kyrgyzstan
-
 Laos
Laos
-
 Latvia
-
 Lebanon
-
 Lesotho
-
 Libya
Libya
-
 Lithuania
-
 Luxembourg
-
 Madagascar
-
 Malaysia
-
 Malta
Malta
-
 Mauritius
-
 Mexico
-
 Moldova
-
 Mongolia
-
 Montenegro
-
 Morocco
-
 Mozambique
-
 Myanmar
-
 Namibia
-
 Nepal
Nepal
-
 Netherlands
-
 New Zealand
-
 Nigeria
-
 North Macedonia
-
 Norway
-
 Oman
Oman
-
 Pakistan
-
 Palestine
-
 Panama
-
 Papua New Guinea
-
 Paraguay
-
 Peru
Peru
-
 Philippines
-
 Poland
-
 Portugal
-
 Puerto Rico
-
 Qatar
Qatar
-
 Reunion
-
 Romania
-
 Rwanda
-
 Saudi Arabia
-
 Serbia
-
 Singapore
-
 Slovakia
-
 Slovenia
-
 Somalia
-
 South Africa
-
 Spain
Spain
-
 Sri Lanka
-
 Sweden
-
 Switzerland
-
 Syria
Syria
-
 Taiwan
-
 Tajikistan
-
 Tanzania
-
 Thailand
-
 Trinidad and Tobago
-
 Tunisia
-
 Turkey
-
 UAE
UAE
-
 Uganda
-
 Ukraine
-
 United Kingdom
-
United States
-
 Uruguay
-
 Uzbekistan
-
 Venezuela
-
 Vietnam
-
 Yemen
Yemen
-
 Zambia
-
 Zimbabwe
- Forex
- Crypto
