
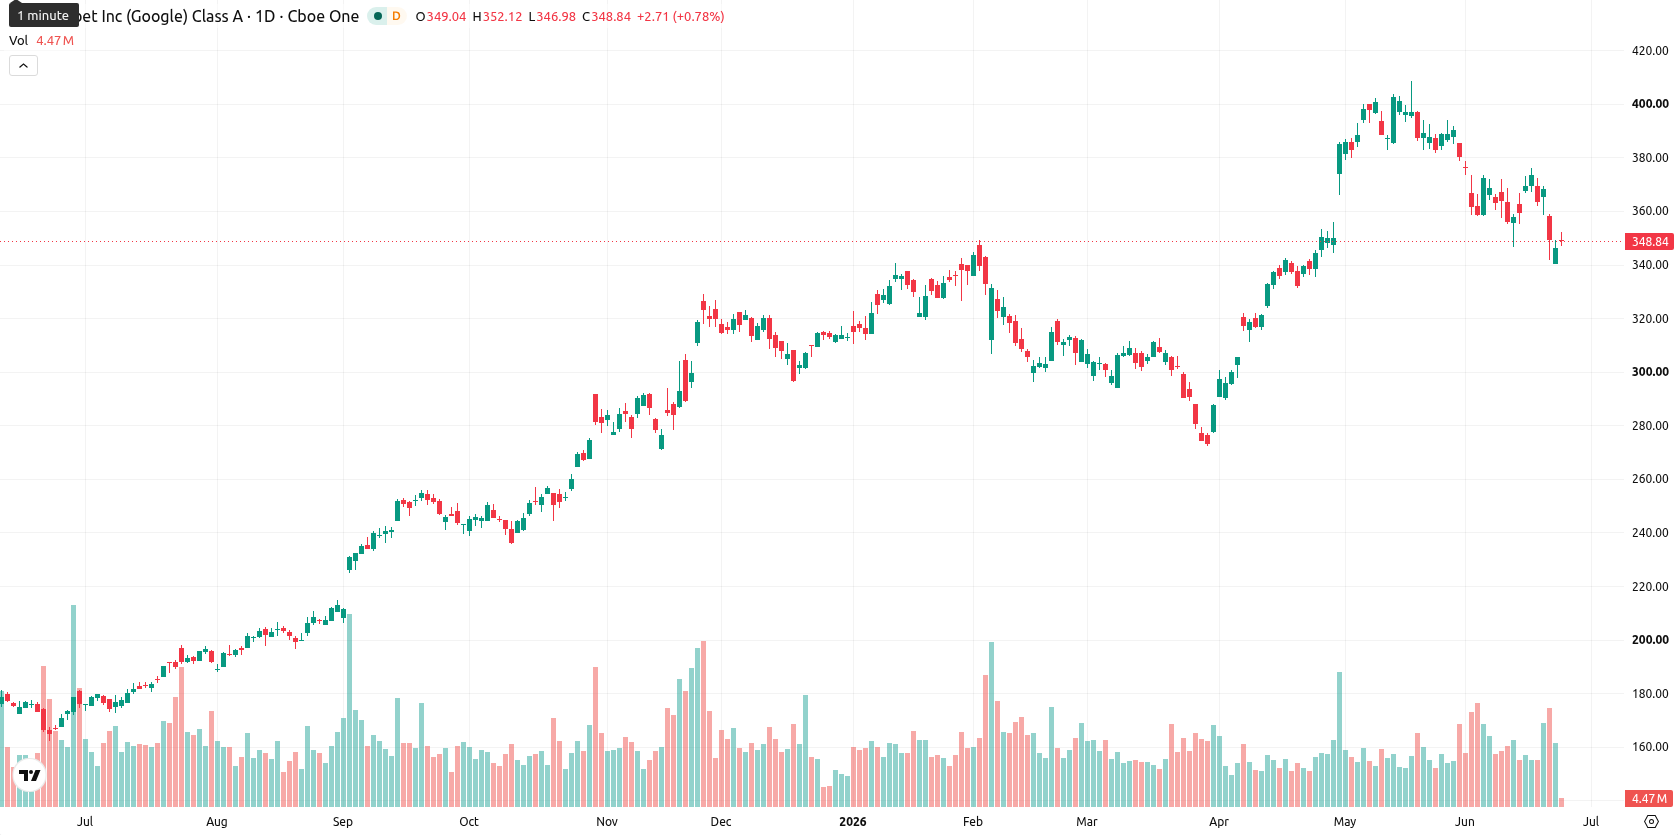
Alphabet shares slip as price finds support above MA-20 at $339.65: weekly forecast

Alphabet Inc. (GOOGL) closed the week at $350.42, declining $17.47, or 5.20%, since the previous weekly close. Despite the pullback, GOOGL remains above its weekly MA-20 ($339.65), MA-50 ($296.54), and MA-200 ($180.73), indicating persistent medium- and long-term bullish support even as price action has turned negative.
Highlights
- GOOGL maintains medium- and long-term bullish technical structure with price holding above key support zones despite a recent 5.2% pullback.
- Short-term momentum signals are mixed, with oversold readings and bearish price action suggesting ongoing selling pressure and a lack of immediate rebound.
- GOOGL is expected to trade between $337 and $359 this week, with a 75% chance of sideways or modest upward movement rather than further downside.
AI leadership exits and cloud milestones shape investor sentiment this week
Alphabet is dealing with heightened investor concern following the departure of leading AI researchers, including John Jumper and Noam Shazeer, to rival companies. Investor sentiment has also been impacted by the company's heavy capital expenditures on artificial intelligence and uncertainty in the speed of monetizing these investments. Alphabet’s cloud business, however, reached a record backlog of $462 billion, and the company announced its upcoming inclusion in the Dow Jones Industrial Average, replacing Verizon effective June 29.
Mixed momentum emerges as key support holds amid oversold signals
On the weekly (W1) timeframe, GOOGL is trading well above its MA-20, MA-50, and MA-200, reinforcing a longer-term bullish trend. The current price hovers close to both the MA-20 and the Ichimoku Kijun level at $340.36, suggesting these values may act as dynamic support. Weekly indicators are mixed: MACD and ADX highlight continued bullish momentum, but oscillators reflect neutral or oversold signals, with RSI remaining moderately bullish and the Commodity Channel Index nearly flat. Stochastic RSI shows a neutral pattern while Bull/Bear Power is firmly oversold, pointing to persistent selling pressure over the week. Weekly volatility is measured at 8.11%, and the price currently sits in the lower part of its latest weekly range.
Limited rebound likely as sideways range expected in the coming week
For the next five trading days, GOOGL is expected to remain in a sideways corridor between $337 and $359 in line with recent weekly volatility and momentum signals. There is about a 75% probability of a modest recovery, with stabilization above the $339 support more likely than further downside. A bullish scenario would be triggered by a breakout above $359, which could signal a reversal of the recent downtrend. Conversely, a close below $337 would increase the probability of additional losses, although the overall weekly setup favors stabilization or a limited rebound.
Earlier, analysts noted that Alphabet’s addition to the Dow Jones Industrial Average increased the stock’s visibility amid broader efforts by investors to regain confidence in technology shares. With growing investor scrutiny around Alphabet’s AI strategy and recent high-profile departures, traders should closely monitor price stability above $339 as a signal of sustained support in the current market environment.


Latest Google News


-
 Afghanistan
-
 Albania
-
 Algeria
-
 Angola
-
 Argentina
-
 Armenia
-
 Australia
-
 Austria
-
 Azerbaijan
-
 Bahamas
-
 Bahrain
-
 Bangladesh
-
 Belarus
-
 Belgium
-
 Bolivia
-
 Botswana
-
 Brazil
-
 Brunei
-
 Bulgaria
-
 Cambodia
-
 Cameroon
-
 Canada
-
 Chile
Chile
-
 China
China
-
 Colombia
-
 Congo
Congo
-
 Costa Rica
-
 Cote d'Ivoire
-
 Croatia
-
 Cuba
Cuba
-
 Cyprus
-
 Czechia
-
 DR Congo
-
 Denmark
-
 Dominican Republic
-
 Ecuador
-
 Egypt
Egypt
-
 El Salvador
-
 Estonia
-
 Eswatini
-
 Ethiopia
-
 Finland
-
 France
-
 Georgia
-
 Germany
-
 Ghana
Ghana
-
 Greece
-
 Haiti
Haiti
-
 Hong Kong
-
 Hungary
-
 India
India
-
 Indonesia
-
 Iran, Islamic republic
-
 Iraq
Iraq
-
 Ireland
-
 Israel
-
 Italy
Italy
-
 Jamaica
-
 Japan
Japan
-
 Jordan
-
 Kazakhstan
-
 Kenya
Kenya
-
 Korea
Korea
-
 Kuwait
-
 Kyrgyzstan
-
 Laos
Laos
-
 Latvia
-
 Lebanon
-
 Lesotho
-
 Libya
Libya
-
 Lithuania
-
 Luxembourg
-
 Madagascar
-
 Malaysia
-
 Malta
Malta
-
 Mauritius
-
 Mexico
-
 Moldova
-
 Mongolia
-
 Montenegro
-
 Morocco
-
 Mozambique
-
 Myanmar
-
 Namibia
-
 Nepal
Nepal
-
 Netherlands
-
 New Zealand
-
 Nigeria
-
 North Macedonia
-
 Norway
-
 Oman
Oman
-
 Pakistan
-
 Palestine
-
 Panama
-
 Papua New Guinea
-
 Paraguay
-
 Peru
Peru
-
 Philippines
-
 Poland
-
 Portugal
-
 Puerto Rico
-
 Qatar
Qatar
-
 Reunion
-
 Romania
-
 Rwanda
-
 Saudi Arabia
-
 Serbia
-
 Singapore
-
 Slovakia
-
 Slovenia
-
 Somalia
-
 South Africa
-
 Spain
Spain
-
 Sri Lanka
-
 Sweden
-
 Switzerland
-
 Syria
Syria
-
 Taiwan
-
 Tajikistan
-
 Tanzania
-
 Thailand
-
 Trinidad and Tobago
-
 Tunisia
-
 Turkey
-
 UAE
UAE
-
 Uganda
-
 Ukraine
-
 United Kingdom
-
United States
-
 Uruguay
-
 Uzbekistan
-
 Venezuela
-
 Vietnam
-
 Yemen
Yemen
-
 Zambia
-
 Zimbabwe
- Forex
- Crypto
