
Starbucks stock price forecast: $106.69 resistance as SBUX gains 3.08%

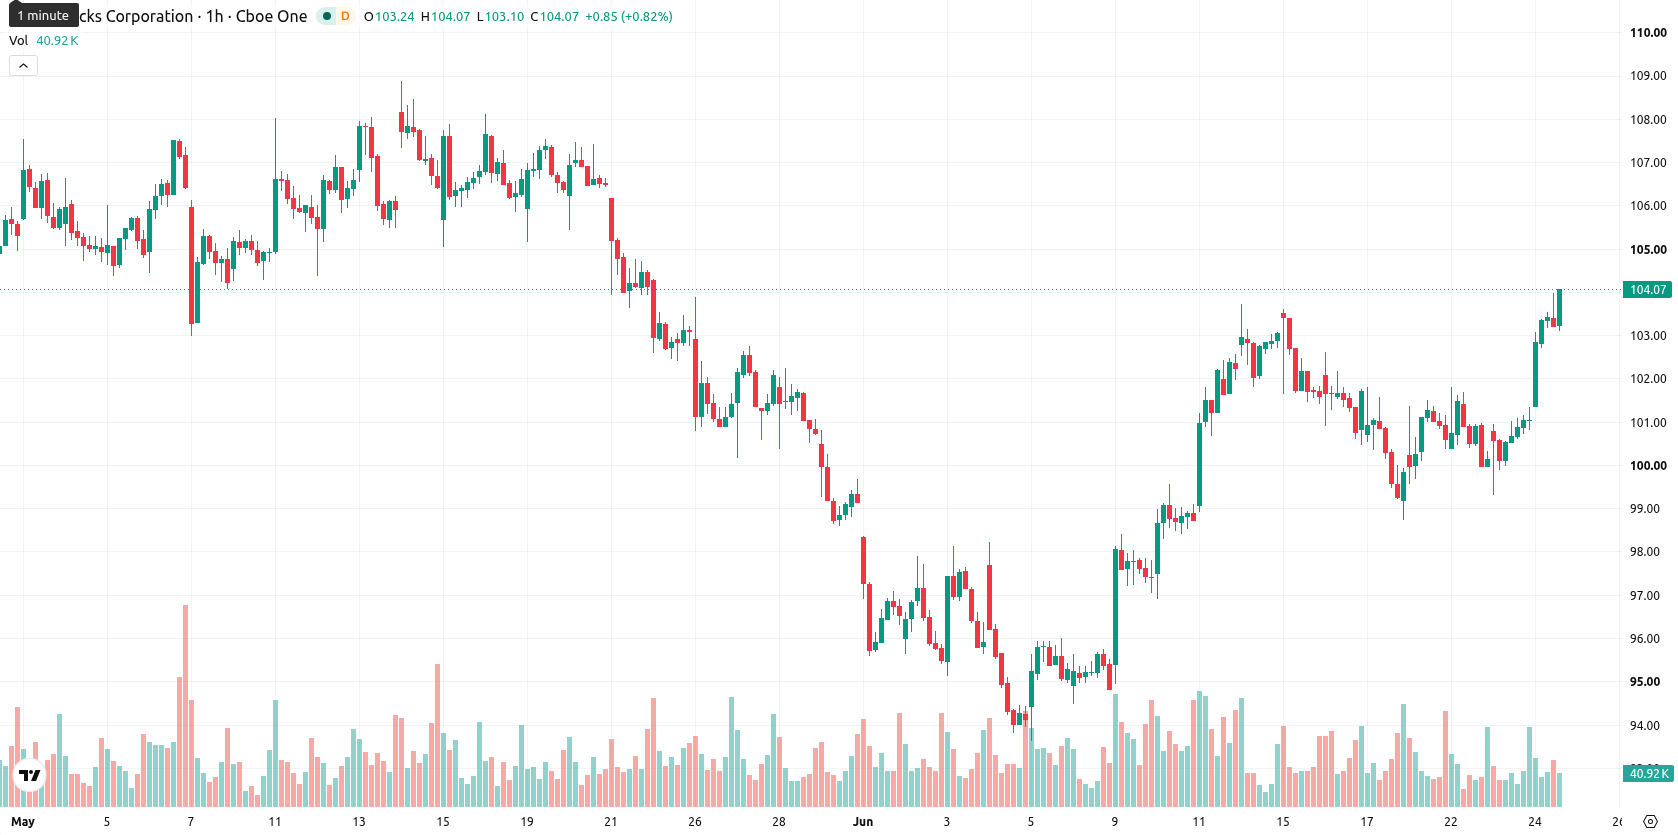
Starbucks (SBUX) stock is trading at $104.17 after climbing 3.08% for the day. The price sits above its key moving averages, indicating strong momentum relative to recent trends.
Highlights
- Starbucks divested a majority stake in its China business, generating new liquidity and streamlining global operations.
- Strategic review of the Japan business could unlock up to $3.10 billion for capital redeployment and growth investments.
- SBUX maintains a strong bullish technical structure with robust momentum, trading above critical supports and expected to consolidate between $103.03 and $106.69.
China stake sale and Japan review drive liquidity and capital strategy
Starbucks has completed the sale of a majority stake in its China business, a move that generates fresh liquidity and streamlines the company's international operations. The decision is complemented by a review of strategic options for the Japan business, potentially unlocking up to $3.10 billion in value and offering opportunities to reallocate capital for further growth. Starbucks is also accelerating its global expansion and store reset initiatives while managing increased labor, remodeling, and compliance costs. Recent actions such as the appointment of Val Bauduin as principal accounting officer, authorization of new debt tenders, increased dividends, and continued share buybacks further reinforce its growth and capital return strategy.
Bullish momentum meets overbought signals near intraday highs
SBUX currently trades above the MA-20 ($101.31), MA-50 ($101.33) on the hourly chart, and the long-term MA-200 ($92.03, daily). The Ichimoku Kijun at $101.62 acts as immediate support for the price. Momentum readings show the Moving Average Convergence Divergence (MACD) on a Buy signal and the Average Directional Index (ADX) rated Neutral. Relative Strength Index (RSI) reads 67.72, indicating a Buy, but the presence of overbought signals from the Stochastic RSI, Commodity Channel Index (CCI), and Bull/Bear Power highlights stretched short-term conditions. The Awesome Oscillator also supports the upward trend, while recent price action near the intraday high suggests persistent bullish pressure despite overbought readings.
Consolidation eyed as price tests upper and lower trading range
In the short term, SBUX is expected to trade within the $103.03 to $106.69 range, capturing typical volatility relative to current levels. A baseline scenario envisions consolidation inside this band as the asset digests recent gains. A bullish outcome could see a breakout above resistance driving further upside, while a drop below immediate support would likely spark a short-term correction.
Earlier, analysts noted that Starbucks was showing mixed momentum signals as it approached technical resistance, with investors watching for confirmation of a breakout or reversal. The latest developments strengthen the bullish narrative with improved momentum and operational progress, but overbought indicators and persistent price pressure make it critical for traders to monitor for a sustained move above resistance or a potential correction from elevated levels.


Latest Starbucks News


-
 Afghanistan
-
 Albania
-
 Algeria
-
 Angola
-
 Argentina
-
 Armenia
-
 Australia
-
 Austria
-
 Azerbaijan
-
 Bahamas
-
 Bahrain
-
 Bangladesh
-
 Belarus
-
 Belgium
-
 Bolivia
-
 Botswana
-
 Brazil
-
 Brunei
-
 Bulgaria
-
 Cambodia
-
 Cameroon
-
 Canada
-
 Chile
Chile
-
 China
China
-
 Colombia
-
 Congo
Congo
-
 Costa Rica
-
 Cote d'Ivoire
-
 Croatia
-
 Cuba
Cuba
-
 Cyprus
-
 Czechia
-
 DR Congo
-
 Denmark
-
 Dominican Republic
-
 Ecuador
-
 Egypt
Egypt
-
 El Salvador
-
 Estonia
-
 Eswatini
-
 Ethiopia
-
 Finland
-
 France
-
 Georgia
-
 Germany
-
 Ghana
Ghana
-
 Greece
-
 Haiti
Haiti
-
 Hong Kong
-
 Hungary
-
 India
India
-
 Indonesia
-
 Iran, Islamic republic
-
 Iraq
Iraq
-
 Ireland
-
 Israel
-
 Italy
Italy
-
 Jamaica
-
 Japan
Japan
-
 Jordan
-
 Kazakhstan
-
 Kenya
Kenya
-
 Korea
Korea
-
 Kuwait
-
 Kyrgyzstan
-
 Laos
Laos
-
 Latvia
-
 Lebanon
-
 Lesotho
-
 Libya
Libya
-
 Lithuania
-
 Luxembourg
-
 Madagascar
-
 Malaysia
-
 Malta
Malta
-
 Mauritius
-
 Mexico
-
 Moldova
-
 Mongolia
-
 Montenegro
-
 Morocco
-
 Mozambique
-
 Myanmar
-
 Namibia
-
 Nepal
Nepal
-
 Netherlands
-
 New Zealand
-
 Nigeria
-
 North Macedonia
-
 Norway
-
 Oman
Oman
-
 Pakistan
-
 Palestine
-
 Panama
-
 Papua New Guinea
-
 Paraguay
-
 Peru
Peru
-
 Philippines
-
 Poland
-
 Portugal
-
 Puerto Rico
-
 Qatar
Qatar
-
 Reunion
-
 Romania
-
 Rwanda
-
 Saudi Arabia
-
 Serbia
-
 Singapore
-
 Slovakia
-
 Slovenia
-
 Somalia
-
 South Africa
-
 Spain
Spain
-
 Sri Lanka
-
 Sweden
-
 Switzerland
-
 Syria
Syria
-
 Taiwan
-
 Tajikistan
-
 Tanzania
-
 Thailand
-
 Trinidad and Tobago
-
 Tunisia
-
 Turkey
-
 UAE
UAE
-
 Uganda
-
 Ukraine
-
 United Kingdom
-
United States
-
 Uruguay
-
 Uzbekistan
-
 Venezuela
-
 Vietnam
-
 Yemen
Yemen
-
 Zambia
-
 Zimbabwe
- Forex
- Crypto
