
Henry Schein stock extends gains as price holds above key moving averages

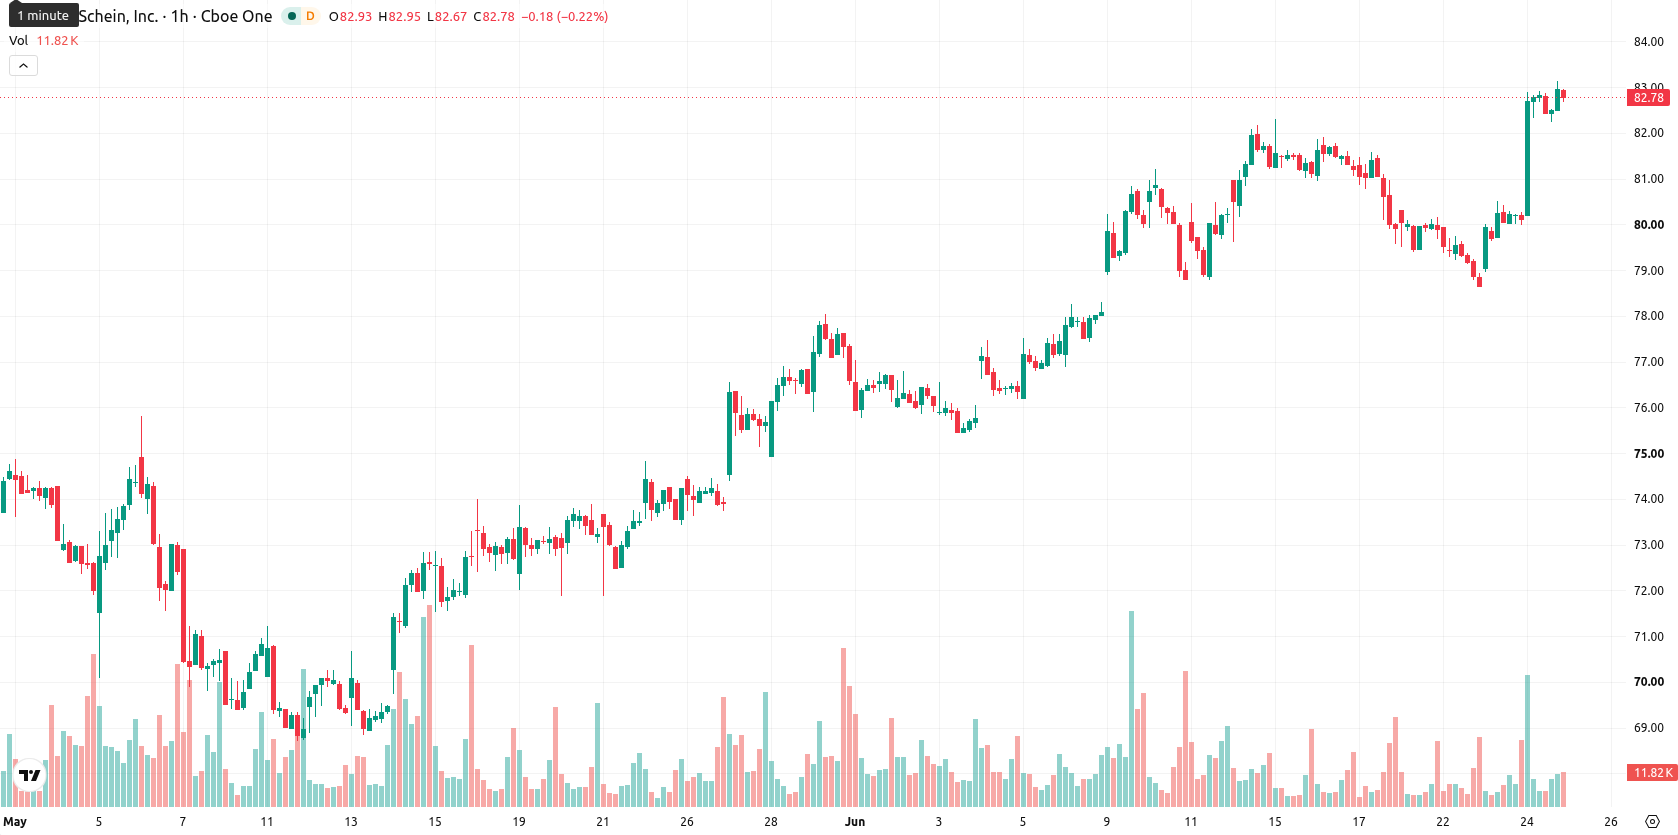
Henry Schein Inc (HSIC) stock is trading at $82.84 after rising 3.42% on the day, closing near the session’s high. The price remains above its key moving averages across both short- and long-term timeframes, indicating continued momentum in the current trend.
Highlights
- HSIC/USD extends its bullish momentum, trading above key moving averages across multiple timeframes and holding near session highs.
- Momentum indicators unanimously signal continued upside, but overbought oscillators suggest potential for short-term consolidation or exhaustion.
- Expected trading range is $81.64 to $84.56; upside probability remains high at 75% barring a drop below immediate support.
Bullish momentum persists amid overbought signal warnings
On the hourly chart, HSIC is holding above the MA-20 at $80.73 and MA-50 at $80.8, with daily price action also above the MA-200 at $73.78. The Ichimoku Kijun at $80.88 is acting as immediate support. Momentum is strong across several indicators: the Moving Average Convergence Divergence (MACD) and Average Directional Index (ADX) both signal a buy, while the Awesome Oscillator confirms bullish momentum. However, the Relative Strength Index (RSI) at 71.04, Stochastic RSI, and Commodity Channel Index (CCI) all remain in overbought territory, and persistent Bull/Bear Power indicates dominant buyer pressure intraday.
Sideways consolidation expected as volatility and upside risk remain
Looking into the next several days, the expected trading range is between $81.64 and $84.56, reflecting typical volatility relative to current levels. There is a 75% probability of continued upward movement, with a lower probability of a reversal to the downside. The base case anticipates price consolidating in a sideways corridor; a bullish scenario would see HSIC breaking above resistance and extending gains, while a bearish outcome could develop if the price falls below immediate support.
Previously it was reported that Henry Schein was exhibiting strong bullish momentum driven by technical buying and trend alignment. The latest price action not only reinforces this bullish outlook but also raises the possibility of short-term overextension, making a close eye on potential consolidation or a pullback from current elevated levels critical for traders.


Latest Henry Schein Inc News


-
 Afghanistan
-
 Albania
-
 Algeria
-
 Angola
-
 Argentina
-
 Armenia
-
 Australia
-
 Austria
-
 Azerbaijan
-
 Bahamas
-
 Bahrain
-
 Bangladesh
-
 Belarus
-
 Belgium
-
 Bolivia
-
 Botswana
-
 Brazil
-
 Brunei
-
 Bulgaria
-
 Cambodia
-
 Cameroon
-
 Canada
-
 Chile
Chile
-
 China
China
-
 Colombia
-
 Congo
Congo
-
 Costa Rica
-
 Cote d'Ivoire
-
 Croatia
-
 Cuba
Cuba
-
 Cyprus
-
 Czechia
-
 DR Congo
-
 Denmark
-
 Dominican Republic
-
 Ecuador
-
 Egypt
Egypt
-
 El Salvador
-
 Estonia
-
 Eswatini
-
 Ethiopia
-
 Finland
-
 France
-
 Georgia
-
 Germany
-
 Ghana
Ghana
-
 Greece
-
 Haiti
Haiti
-
 Hong Kong
-
 Hungary
-
 India
India
-
 Indonesia
-
 Iran, Islamic republic
-
 Iraq
Iraq
-
 Ireland
-
 Israel
-
 Italy
Italy
-
 Jamaica
-
 Japan
Japan
-
 Jordan
-
 Kazakhstan
-
 Kenya
Kenya
-
 Korea
Korea
-
 Kuwait
-
 Kyrgyzstan
-
 Laos
Laos
-
 Latvia
-
 Lebanon
-
 Lesotho
-
 Libya
Libya
-
 Lithuania
-
 Luxembourg
-
 Madagascar
-
 Malaysia
-
 Malta
Malta
-
 Mauritius
-
 Mexico
-
 Moldova
-
 Mongolia
-
 Montenegro
-
 Morocco
-
 Mozambique
-
 Myanmar
-
 Namibia
-
 Nepal
Nepal
-
 Netherlands
-
 New Zealand
-
 Nigeria
-
 North Macedonia
-
 Norway
-
 Oman
Oman
-
 Pakistan
-
 Palestine
-
 Panama
-
 Papua New Guinea
-
 Paraguay
-
 Peru
Peru
-
 Philippines
-
 Poland
-
 Portugal
-
 Puerto Rico
-
 Qatar
Qatar
-
 Reunion
-
 Romania
-
 Rwanda
-
 Saudi Arabia
-
 Serbia
-
 Singapore
-
 Slovakia
-
 Slovenia
-
 Somalia
-
 South Africa
-
 Spain
Spain
-
 Sri Lanka
-
 Sweden
-
 Switzerland
-
 Syria
Syria
-
 Taiwan
-
 Tajikistan
-
 Tanzania
-
 Thailand
-
 Trinidad and Tobago
-
 Tunisia
-
 Turkey
-
 UAE
UAE
-
 Uganda
-
 Ukraine
-
 United Kingdom
-
United States
-
 Uruguay
-
 Uzbekistan
-
 Venezuela
-
 Vietnam
-
 Yemen
Yemen
-
 Zambia
-
 Zimbabwe
- Forex
- Crypto
