
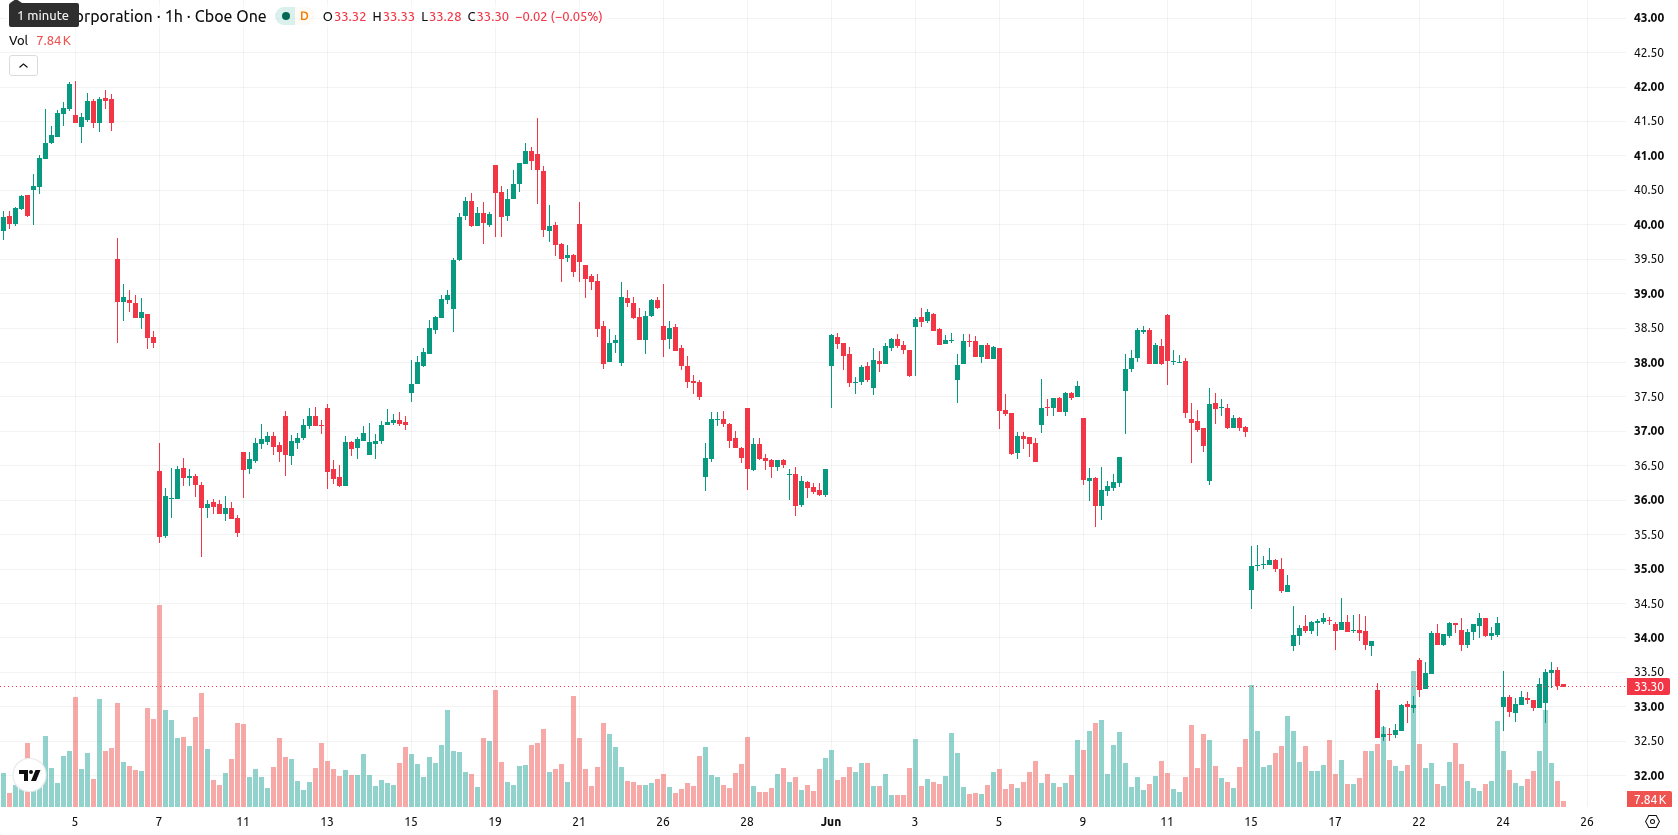
$33.50 resistance caps APA stock as it trades sideways

APA (APA) stock is trading at $33.31, slipping slightly in today's session. The stock is currently positioned below its key moving averages, reflecting sustained pressure from sellers in both the short and medium term.
Highlights
- APA faces sustained selling pressure as the stock trades below key short- and medium-term moving averages.
- Bearish momentum dominates with most momentum signals supporting further downside, despite isolated intraday buyer activity.
- Price is forecast to consolidate between $32.55 and $34.07, with a 78% probability of further declines if support breaks.
Bearish momentum builds as resistance holds above support
On the technical side, APA is trading below the 20- and 50-period moving averages on the hourly chart, while price remains above the 200-period moving average on the daily time frame. Immediate resistance is marked by the Ichimoku Kijun at $33.50, with support established at $32.55. Momentum signals are predominantly bearish: both the Moving Average Convergence Divergence (MACD) and Average Directional Index (ADX) indicate a sell bias. The Relative Strength Index (RSI) is at 46.94, reflecting selling conditions. Commodity Channel Index (CCI) and Stochastic RSI are both neutral, while Bull/Bear Power (BBP) provides a buy signal, hinting at some buyer activity intraday. The Awesome Oscillator is neutral and does not reinforce either trend.
Downside risk elevated as consolidation faces technical limits
Over the next few trading days, APA is projected to fluctuate within a range of $32.55 to $34.07. The probability of further downside is estimated at 78%, with upward movement less likely at 22%. The baseline scenario sees APA consolidating within this forecast band, with a possible move toward the upper end if price breaks above $33.50 resistance. In a bearish scenario, a decline below $32.55 support could trigger additional selling.
Earlier, analysts noted that APA maintained a robust bullish structure and strong momentum across multiple timeframes. The current technical setup signals a shift toward bearish pressure, making a potential breakdown below $32.55 an important risk for traders to monitor in the coming sessions.


Latest APA Corporation News


-
 Afghanistan
-
 Albania
-
 Algeria
-
 Angola
-
 Argentina
-
 Armenia
-
 Australia
-
 Austria
-
 Azerbaijan
-
 Bahamas
-
 Bahrain
-
 Bangladesh
-
 Belarus
-
 Belgium
-
 Bolivia
-
 Botswana
-
 Brazil
-
 Brunei
-
 Bulgaria
-
 Cambodia
-
 Cameroon
-
 Canada
-
 Chile
Chile
-
 China
China
-
 Colombia
-
 Congo
Congo
-
 Costa Rica
-
 Cote d'Ivoire
-
 Croatia
-
 Cuba
Cuba
-
 Cyprus
-
 Czechia
-
 DR Congo
-
 Denmark
-
 Dominican Republic
-
 Ecuador
-
 Egypt
Egypt
-
 El Salvador
-
 Estonia
-
 Eswatini
-
 Ethiopia
-
 Finland
-
 France
-
 Georgia
-
 Germany
-
 Ghana
Ghana
-
 Greece
-
 Haiti
Haiti
-
 Hong Kong
-
 Hungary
-
 India
India
-
 Indonesia
-
 Iran, Islamic republic
-
 Iraq
Iraq
-
 Ireland
-
 Israel
-
 Italy
Italy
-
 Jamaica
-
 Japan
Japan
-
 Jordan
-
 Kazakhstan
-
 Kenya
Kenya
-
 Korea
Korea
-
 Kuwait
-
 Kyrgyzstan
-
 Laos
Laos
-
 Latvia
-
 Lebanon
-
 Lesotho
-
 Libya
Libya
-
 Lithuania
-
 Luxembourg
-
 Madagascar
-
 Malaysia
-
 Malta
Malta
-
 Mauritius
-
 Mexico
-
 Moldova
-
 Mongolia
-
 Montenegro
-
 Morocco
-
 Mozambique
-
 Myanmar
-
 Namibia
-
 Nepal
Nepal
-
 Netherlands
-
 New Zealand
-
 Nigeria
-
 North Macedonia
-
 Norway
-
 Oman
Oman
-
 Pakistan
-
 Palestine
-
 Panama
-
 Papua New Guinea
-
 Paraguay
-
 Peru
Peru
-
 Philippines
-
 Poland
-
 Portugal
-
 Puerto Rico
-
 Qatar
Qatar
-
 Reunion
-
 Romania
-
 Rwanda
-
 Saudi Arabia
-
 Serbia
-
 Singapore
-
 Slovakia
-
 Slovenia
-
 Somalia
-
 South Africa
-
 Spain
Spain
-
 Sri Lanka
-
 Sweden
-
 Switzerland
-
 Syria
Syria
-
 Taiwan
-
 Tajikistan
-
 Tanzania
-
 Thailand
-
 Trinidad and Tobago
-
 Tunisia
-
 Turkey
-
 UAE
UAE
-
 Uganda
-
 Ukraine
-
 United Kingdom
-
United States
-
 Uruguay
-
 Uzbekistan
-
 Venezuela
-
 Vietnam
-
 Yemen
Yemen
-
 Zambia
-
 Zimbabwe
- Forex
- Crypto
