

Tesla stock falls 7.52% as sellers maintain control in short-term trend

Tesla (TSLA) stock is trading at $393.33, down 7.52% on the day. The price has closed below its key moving averages and remains under notable selling pressure.
 374.90
388.12
374.90
388.12
Highlights
- Tesla's Q2 2026 vehicle deliveries reached 480,126 units, marking a 25% annual increase and exceeding analyst forecasts.
- Regulatory risk eased as the NHTSA closed its brake investigation and Tesla expanded its U.S. SUV lineup with the 6-seat Model Y L.
- TSLA trades below major moving averages and momentum indicators remain bearish, with a projected $364.68 to $421.98 range and further downside likely.
Sentiment buoyed by delivery beat and regulatory relief amid weak price action
Tesla reported second-quarter 2026 global vehicle deliveries of 480,126 and production of 451,758, both exceeding Wall Street expectations and reflecting a 25% year-over-year increase, according to CNBC. This stronger-than-expected operational result highlights resilient demand and improved manufacturing scale, which could support sentiment around the company's core business. Recent regulatory relief arrived as the U.S. National Highway Traffic Safety Administration formally ended its brake probe into nearly 700,000 vehicles, removing a prior market overhang, while Tesla’s official launch of the 6-seat Model Y L at a starting price of $61,990 in the United States, as reported by Electrek, expands its product range in the high-volume SUV segment. The combination of upbeat delivery momentum and regulatory clearance provides fundamentally positive signals, though price action has remained under broader selling pressure.
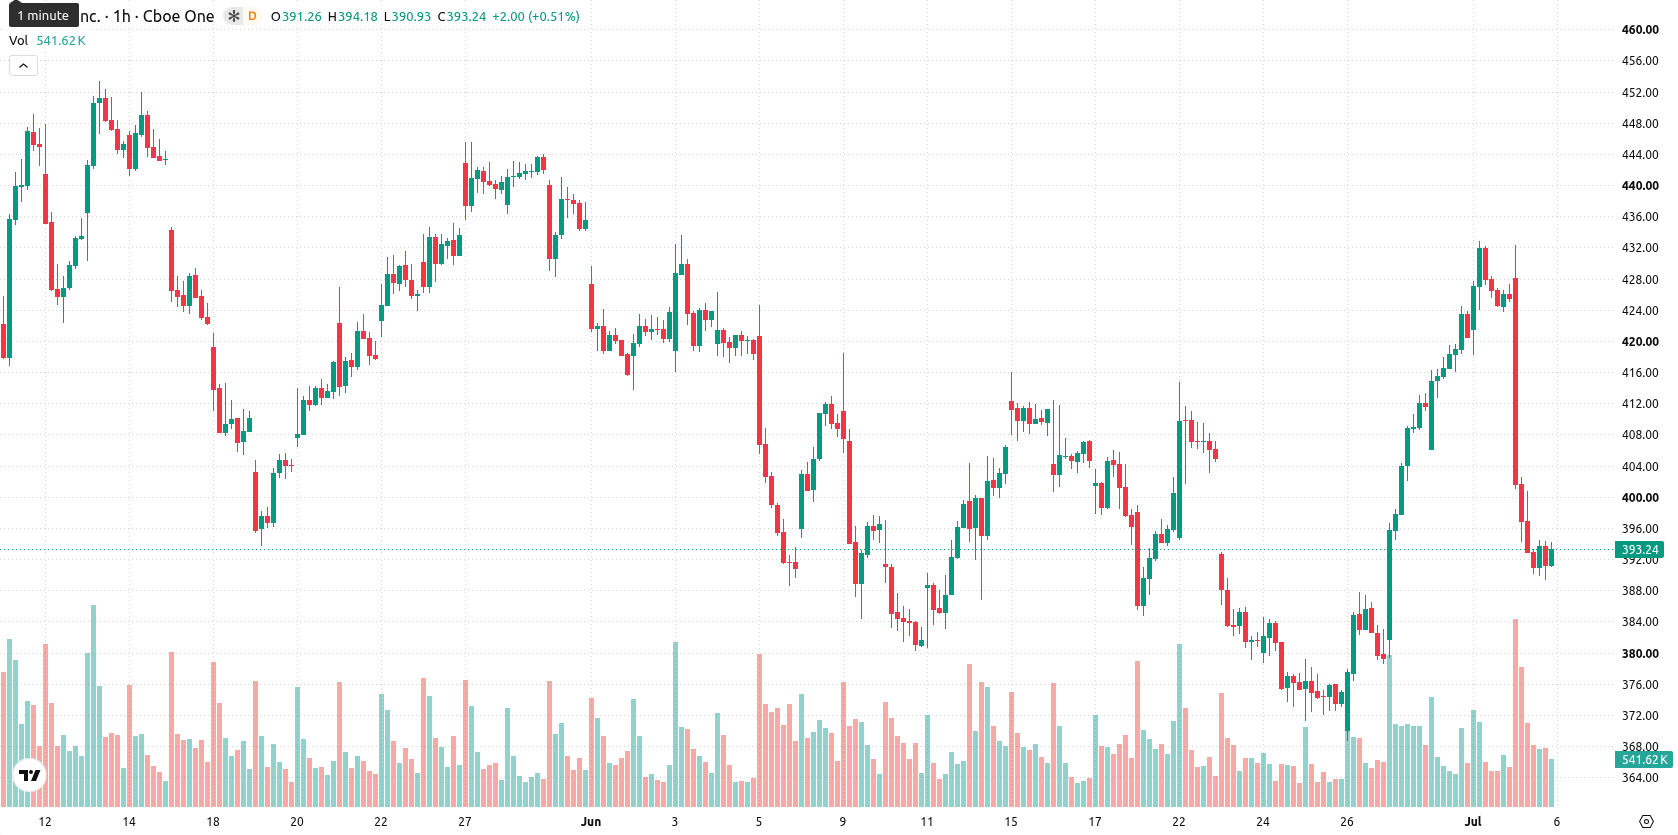
Downward momentum confirmed as multiple technicals signal oversold state
TSLA is trading below several key technical zones, with price closing under the MA-20 ($413.15) and MA-50 ($397.24) levels on the H1 chart and remaining beneath the MA-200 at $418.57 on the daily timeframe. The nearest technical resistance is now located at the Ichimoku Kijun level of $411.08. Momentum readings are weak, as both the Average Directional Index (ADX) and Relative Strength Index (RSI) are on Sell signals, and the Moving Average Convergence Divergence (MACD) is Neutral. Oscillators point to oversold conditions, with the RSI at 37.73, Stochastic RSI and Commodity Channel Index (CCI) in oversold territory, and Bull/Bear Power confirming intraday seller dominance. The Awesome Oscillator further supports the prevailing downward trend.
Downside risk elevated as trading range defines near-term outlook
Over the next 2 to 3 trading days, TSLA is likely to fluctuate within a volatility band of $364.68 to $421.98. Statistically, there is a 32% probability of an upward move and a 68% likelihood of further downside. Should the price remain within this corridor, a sideways pattern may develop; however, a move above the $411.08 resistance could trigger a rebound, while a break below the lower end risks accelerating losses.
Earlier, analysts noted that new Model Y variants and regulatory relief were supporting Tesla’s strategic push to bolster demand amid shifting regional sales patterns. The current technical setup, marked by persistent selling pressure despite robust operational results, suggests traders should watch for a decisive move above $411.08 or below $364.68 as potential signals for the next trend direction.











-
 Afghanistan
-
 Albania
-
 Algeria
-
 Angola
-
 Argentina
-
 Armenia
-
 Australia
-
 Austria
-
 Azerbaijan
-
 Bahamas
-
 Bahrain
-
 Bangladesh
-
 Belarus
-
 Belgium
-
 Bolivia
-
 Botswana
-
 Brazil
-
 Brunei
-
 Bulgaria
-
 Cambodia
-
 Cameroon
-
 Canada
-
 Chile
Chile
-
 China
China
-
 Colombia
-
 Congo
Congo
-
 Costa Rica
-
 Cote d'Ivoire
-
 Croatia
-
 Cuba
Cuba
-
 Cyprus
-
 Czechia
-
 DR Congo
-
 Denmark
-
 Dominican Republic
-
 Ecuador
-
 Egypt
Egypt
-
 El Salvador
-
 Estonia
-
 Eswatini
-
 Ethiopia
-
 Finland
-
 France
-
 Georgia
-
 Germany
-
 Ghana
Ghana
-
 Greece
-
 Haiti
Haiti
-
 Hong Kong
-
 Hungary
-
 India
India
-
 Indonesia
-
 Iran, Islamic republic
-
 Iraq
Iraq
-
 Ireland
-
 Israel
-
 Italy
Italy
-
 Jamaica
-
 Japan
Japan
-
 Jordan
-
 Kazakhstan
-
 Kenya
Kenya
-
 Korea
Korea
-
 Kuwait
-
 Kyrgyzstan
-
 Laos
Laos
-
 Latvia
-
 Lebanon
-
 Lesotho
-
 Libya
Libya
-
 Lithuania
-
 Luxembourg
-
 Madagascar
-
 Malaysia
-
 Malta
Malta
-
 Mauritius
-
 Mexico
-
 Moldova
-
 Mongolia
-
 Montenegro
-
 Morocco
-
 Mozambique
-
 Myanmar
-
 Namibia
-
 Nepal
Nepal
-
 Netherlands
-
 New Zealand
-
 Nigeria
-
 North Macedonia
-
 Norway
-
 Oman
Oman
-
 Pakistan
-
 Palestine
-
 Panama
-
 Papua New Guinea
-
 Paraguay
-
 Peru
Peru
-
 Philippines
-
 Poland
-
 Portugal
-
 Puerto Rico
-
 Qatar
Qatar
-
 Reunion
-
 Romania
-
 Rwanda
-
 Saudi Arabia
-
 Serbia
-
 Singapore
-
 Slovakia
-
 Slovenia
-
 Somalia
-
 South Africa
-
 Spain
Spain
-
 Sri Lanka
-
 Sweden
-
 Switzerland
-
 Syria
Syria
-
 Taiwan
-
 Tajikistan
-
 Tanzania
-
 Thailand
-
 Trinidad and Tobago
-
 Tunisia
-
 Turkey
-
 UAE
UAE
-
 Uganda
-
 Ukraine
-
 United Kingdom
-
United States
-
 Uruguay
-
 Uzbekistan
-
 Venezuela
-
 Vietnam
-
 Yemen
Yemen
-
 Zambia
-
 Zimbabwe
- Forex
- Crypto












