
Meta slides toward $590 as Spain launches probe into alleged Android tracking practices

Meta stock extended its decline on Wednesday, slipping toward the $590 region as regulatory pressure intensified just as the company’s technical structure weakened. The move followed Spain’s decision to open a parliamentary investigation into allegations that Meta used hidden mechanisms to track Android users across Facebook and Instagram without adequate consent.
Highlights
- Meta falls toward $590 as Spain opens an investigation into alleged Android tracking.
- Stock breaks below long-term trendline as all major EMAs now sit above price.
- Momentum remains bearish with RSI drifting into oversold territory and no divergence.
The comments from Prime Minister Pedro Sanchez, who stated that no platform is above national law, amplified political momentum behind the probe. For investors, the timing could not be worse: the investigation hit just as Meta’s chart lost critical trend strength, creating a convergence of regulatory stress and technical deterioration.
Long-term trend breaks as Meta slips beneath key moving averages
The daily chart shows a clear transition from a strong multi-month uptrend to a structured corrective phase. Meta has decisively broken below the ascending trendline that supported the rally from spring through early autumn. The loss of this trendline triggered a wave of technical selling, accelerating the stock’s slide through the 20, 50, 100, and 200-day EMAs.
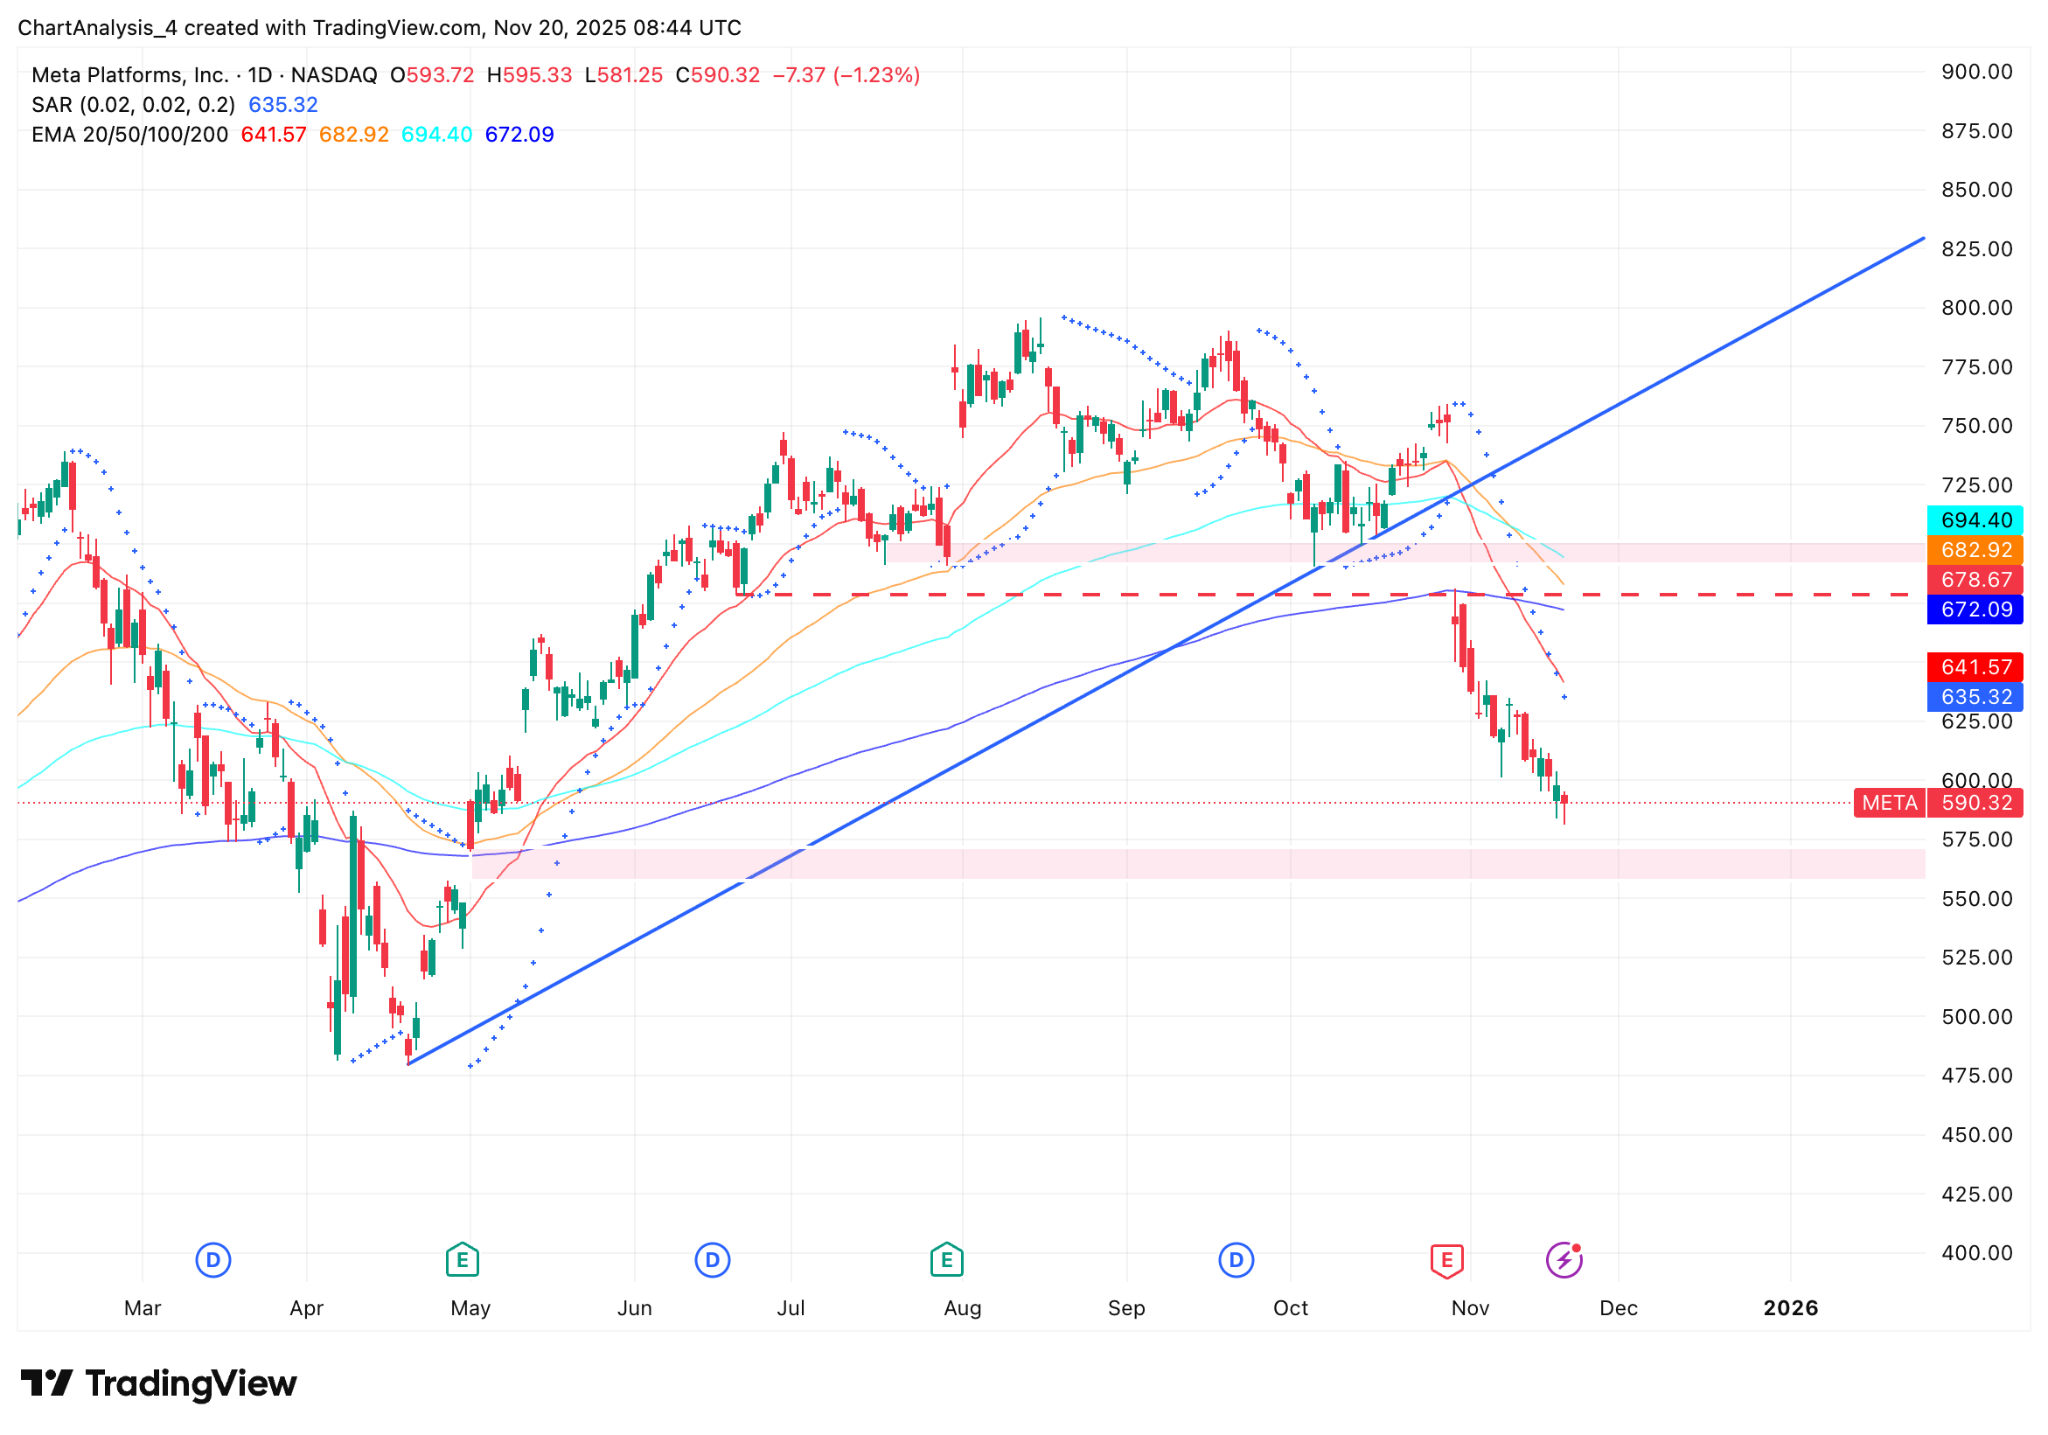
Meta stock price dynamics (Source: TradingView)
All four moving averages now sit above price and slope downward, forming a stacked resistance cluster that reinforces the bearish shift. The Parabolic SAR has remained negative throughout November, confirming consistent downside pressure. Meta is now carving out a pattern of lower highs and lower lows, with price pulling steadily toward the dense support area between $575 and $565—a zone that served as a summer accumulation base.
Momentum indicators offer little optimism. RSI has dipped into a soft oversold region without forming any bullish divergence, signaling that sellers retain control and that the decline remains orderly rather than panicked. The absence of volume spikes suggests that the market has not yet reached exhaustion, leaving the trend vulnerable to further weakness.
Short-term action reinforces bearish conditions as sellers fade every rally
Intraday signals align with the broader decline. On the 30-minute chart, Meta continues to trade beneath the Supertrend indicator, with every push toward the $596–$600 region met by renewed selling. The DMI lines show the negative directional index firmly above the positive index, a classic sign that downward momentum remains dominant.
Short-term traders have treated each bounce as an opportunity to exit long positions or add to shorts, reflecting a market that sees weakness rather than opportunity. Price remains below intraday moving averages, and the lack of strong participation on green candles underscores tepid buyer conviction.
Unless Meta reclaims the $615–$620 region, which aligns with the underside of the broken trendline and the 20-day EMA, sellers maintain a structural advantage. A breakout above this range would signal that buyers are attempting to rebuild a base, but such a shift requires both technical confirmation and a pause in regulatory headlines.
Regulatory pressure amplifies technical breakdown
Spain’s investigation ties into years of tension between Meta and European regulators, who have scrutinized the company over GDPR violations, data-sharing practices, and compliance with the Digital Markets Act. The latest allegations—hidden tracking mechanisms on Android devices—revive the very challenges Meta has tried to move beyond.
The possibility of fines or operational restrictions adds headline risk at a time when the stock is already struggling with weakened technical structure. Meta is scheduled to provide testimony before Spanish authorities, further elevating investor uncertainty.
While Meta maintains strong fundamentals and continues to invest in AI and VR infrastructure, the near-term narrative is dominated by legal and technical clouds. Without stabilization either on the chart or in the regulatory front, the stock risks drifting deeper into the $575–$565 demand area.
Earlier analysis highlighted that Meta’s extended run left it vulnerable to a trendline break, especially if regulatory pressure resurfaced in Europe. This week’s drop confirms that scenario, with the stock moving directly into the downside targets previously outlined around $575–$565.


-
 Afghanistan
-
 Albania
-
 Algeria
-
 Angola
-
 Argentina
-
 Armenia
-
 Australia
-
 Austria
-
 Azerbaijan
-
 Bahamas
-
 Bahrain
-
 Bangladesh
-
 Belarus
-
 Belgium
-
 Bolivia
-
 Botswana
-
 Brazil
-
 Brunei
-
 Bulgaria
-
 Cambodia
-
 Cameroon
-
 Canada
-
 Chile
Chile
-
 China
China
-
 Colombia
-
 Congo
Congo
-
 Costa Rica
-
 Cote d'Ivoire
-
 Croatia
-
 Cuba
Cuba
-
 Cyprus
-
 Czechia
-
 DR Congo
-
 Denmark
-
 Dominican Republic
-
 Ecuador
-
 Egypt
Egypt
-
 El Salvador
-
 Estonia
-
 Eswatini
-
 Ethiopia
-
 Finland
-
 France
-
 Georgia
-
 Germany
-
 Ghana
Ghana
-
 Greece
-
 Haiti
Haiti
-
 Hong Kong
-
 Hungary
-
 India
India
-
 Indonesia
-
 Iran, Islamic republic
-
 Iraq
Iraq
-
 Ireland
-
 Israel
-
 Italy
Italy
-
 Jamaica
-
 Japan
Japan
-
 Jordan
-
 Kazakhstan
-
 Kenya
Kenya
-
 Korea
Korea
-
 Kuwait
-
 Kyrgyzstan
-
 Laos
Laos
-
 Latvia
-
 Lebanon
-
 Lesotho
-
 Libya
Libya
-
 Lithuania
-
 Luxembourg
-
 Madagascar
-
 Malaysia
-
 Malta
Malta
-
 Mauritius
-
 Mexico
-
 Moldova
-
 Mongolia
-
 Montenegro
-
 Morocco
-
 Mozambique
-
 Myanmar
-
 Namibia
-
 Nepal
Nepal
-
 Netherlands
-
 New Zealand
-
 Nigeria
-
 North Macedonia
-
 Norway
-
 Oman
Oman
-
 Pakistan
-
 Palestine
-
 Panama
-
 Papua New Guinea
-
 Paraguay
-
 Peru
Peru
-
 Philippines
-
 Poland
-
 Portugal
-
 Puerto Rico
-
 Qatar
Qatar
-
 Reunion
-
 Romania
-
 Rwanda
-
 Saudi Arabia
-
 Serbia
-
 Singapore
-
 Slovakia
-
 Slovenia
-
 Somalia
-
 South Africa
-
 Spain
Spain
-
 Sri Lanka
-
 Sweden
-
 Switzerland
-
 Syria
Syria
-
 Taiwan
-
 Tajikistan
-
 Tanzania
-
 Thailand
-
 Trinidad and Tobago
-
 Tunisia
-
 Turkey
-
 UAE
UAE
-
 Uganda
-
 Ukraine
-
 United Kingdom
-
United States
-
 Uruguay
-
 Uzbekistan
-
 Venezuela
-
 Vietnam
-
 Yemen
Yemen
-
 Zambia
-
 Zimbabwe
- Forex
- Crypto
