
Meta edges lower as EU legal clash adds pressure to fragile rebound

Meta Platforms closed at $633 on Wednesday, easing slightly after a sharp multi-day rebound that lifted the stock from its November lows. The move comes as the company escalates its challenge against the European Union’s antitrust demands, calling the bloc’s document-collection process “aberrant” and disproportionate.
Highlights
- Meta slips to $633 as EU legal tensions return to focus.
- Rebound from November lows meets heavy EMA resistance near $660–$680.
- Regulatory overhang compounds a fragile chart structure after trendline break.
Meta argues that regulators forced it to produce nearly one million files — including unrelated sensitive records — a claim now at the center of its appeal to the EU Court of Justice. The renewed legal friction reintroduces uncertainty at a moment when the stock is attempting to stabilize following one of its steepest declines of the year.
Technical pressure builds as Meta hits resistance
The stock’s recovery follows a decisive breakdown earlier this month, when Meta fell out of the rising trendline that had defined its rally since April. The slide from the $760–$780 zone drove price straight into the $580 support band, where long-term buyers stepped in aggressively. That reversal aligned with the lower Bollinger Band and the most oversold conditions since late 2022, helping launch a rebound back toward the $631–$635 region.
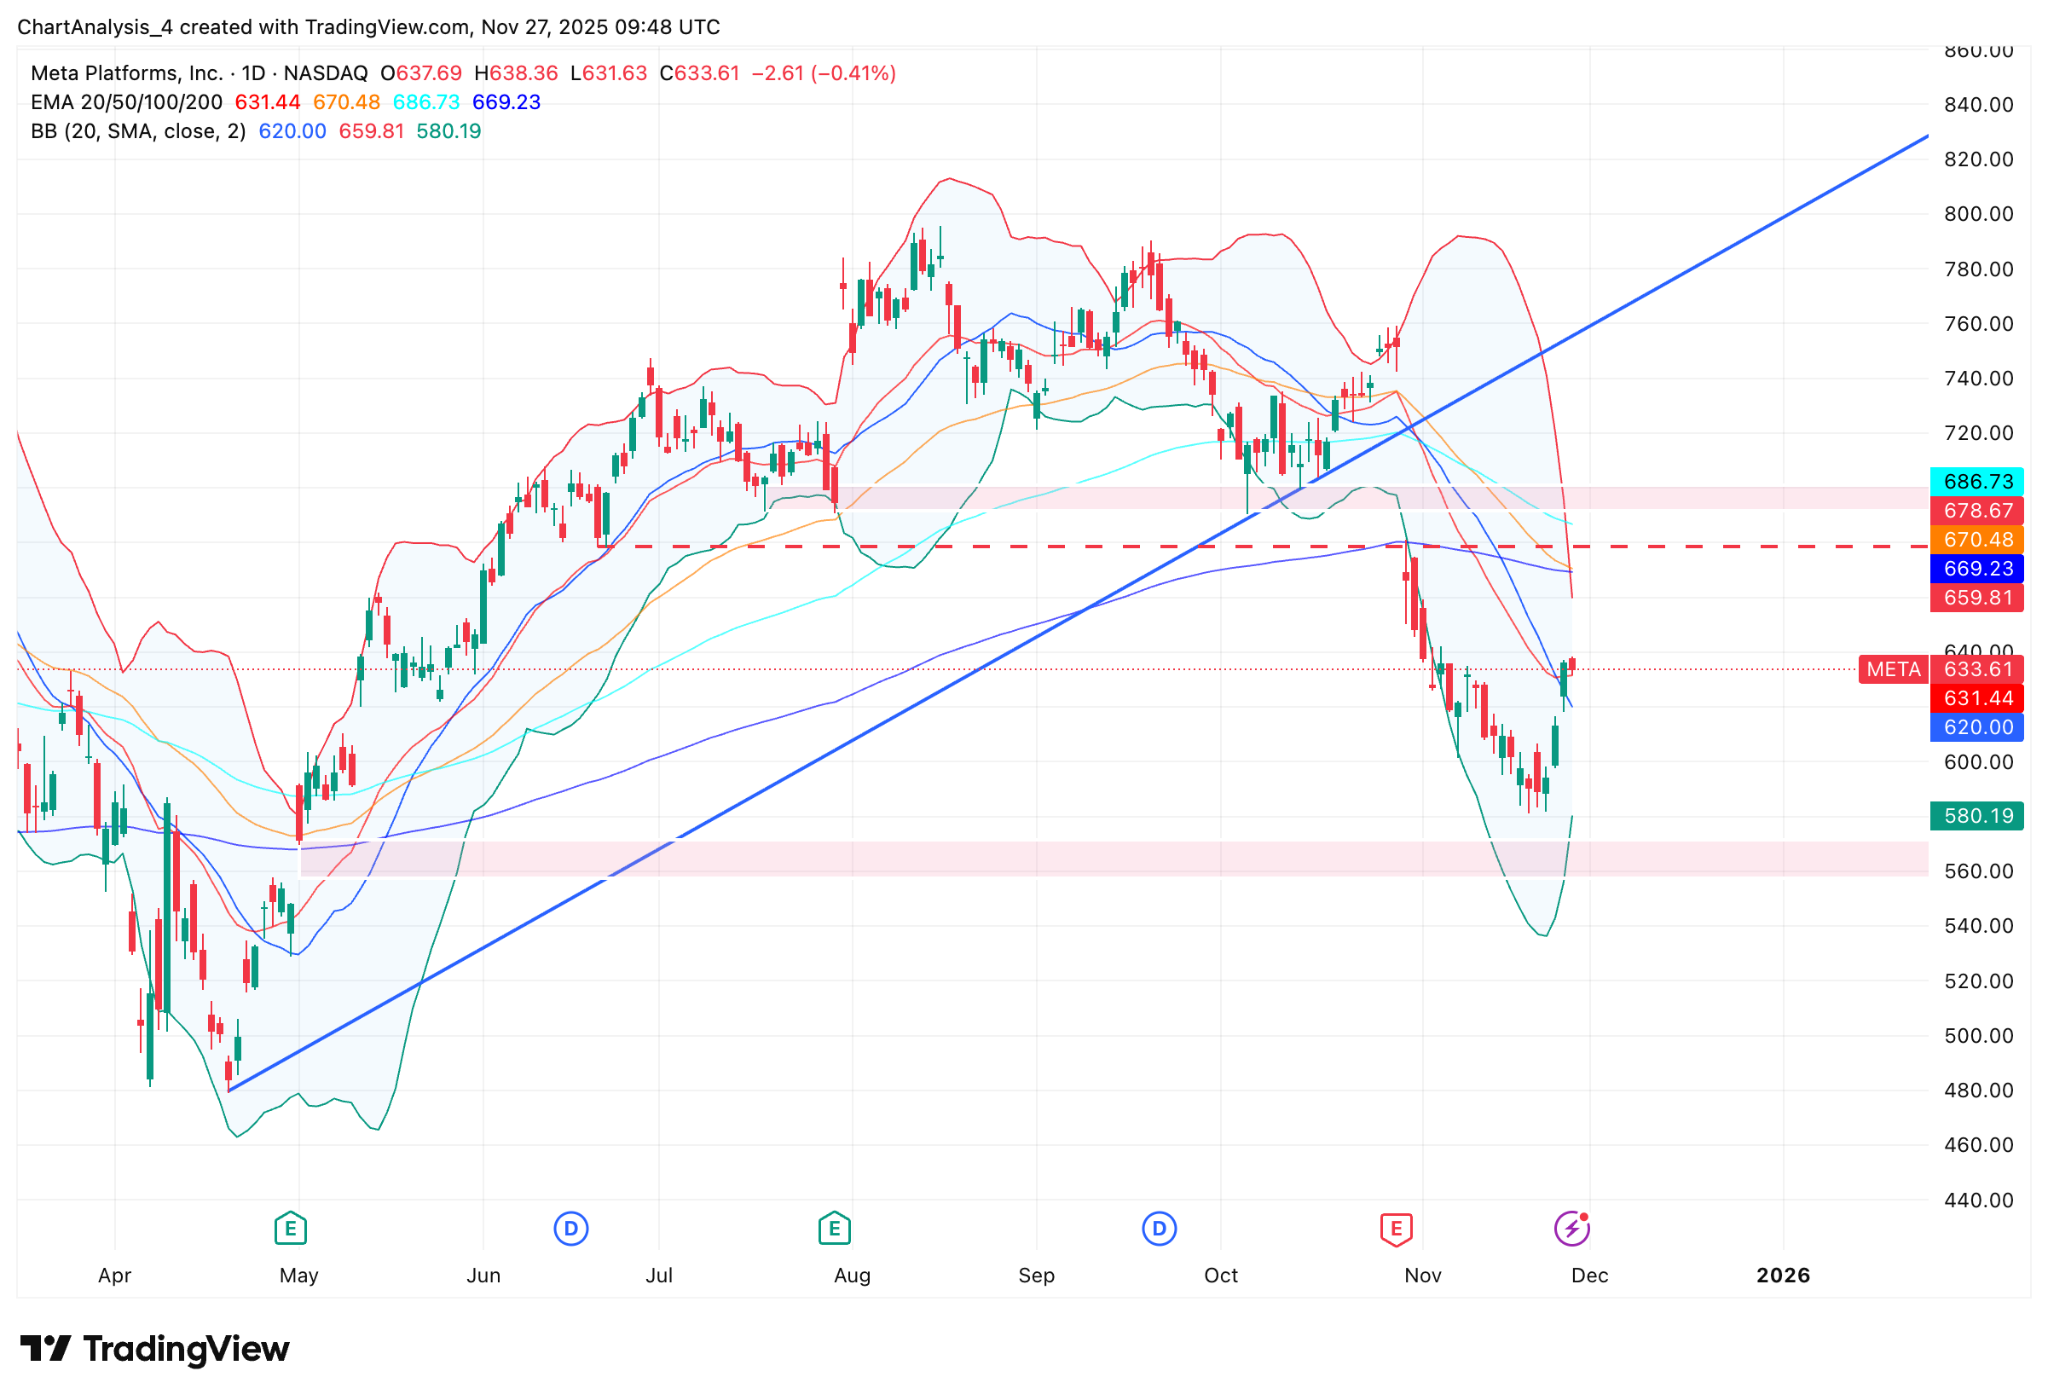
Meta stock price dynamics (Source: TradingView)
The challenge now is the layered resistance overhead. Meta remains below the 50-day EMA at $670, the 100-day EMA at $686 and the 200-day EMA at $669. These levels form a dense ceiling and converge with the descending trendline from the September peak, creating a technical choke point near $660–$680. Without a break above this belt, the recovery risks stalling into another lower-high pattern rather than transitioning into a broader trend reversal.
The Bollinger structure reflects the same tension. Price has moved away from the lower band and is now approaching the midline near $659. Historically, recovering this midpoint is a prerequisite for retesting the upper band, which sits near $688. Yet sellers remain active around the $670 area, the same region that acted as a strong support base earlier in the year.
Regulatory overhang adds volatility
Meta’s clash with Brussels adds a fresh layer of headline risk. The company claims that the European Commission’s demands included sweeping personal documents such as autopsy reports and school records. Regulators countered that many of the search terms used to filter documents were provided by Meta itself. With a €797.7 million penalty already issued last year and a final ruling expected in 2025, the dispute underscores the growing oversight challenges faced by major platforms.
The broader equity landscape adds to the complexity. Tech stocks have been volatile through November, with sentiment repeatedly shifting on macro cues and shifts in risk appetite. Meta’s recovery has outpaced some peers, but until the stock clears its EMA cluster, traders remain cautious about declaring the downtrend broken.
Outlook: Can momentum overcome resistance
The next key marker for traders is whether Meta can hold above $620 and challenge the $660–$680 zone. A decisive break above that region would open a path toward $700 and potentially a retest of the $760–$780 band. Failure to overcome resistance would keep focus on $600, with a deeper slide toward $580 possible if selling pressure returns.
In earlier discussions, we noted that Meta’s trendline break removed a major pillar of technical strength and increased the likelihood of an extended corrective phase. The current rebound reflects strong dip-buying interest, but the stock must reclaim its EMA cluster to shift the market’s bias back toward sustained upside.


-
 Afghanistan
-
 Albania
-
 Algeria
-
 Angola
-
 Argentina
-
 Armenia
-
 Australia
-
 Austria
-
 Azerbaijan
-
 Bahamas
-
 Bahrain
-
 Bangladesh
-
 Belarus
-
 Belgium
-
 Bolivia
-
 Botswana
-
 Brazil
-
 Brunei
-
 Bulgaria
-
 Cambodia
-
 Cameroon
-
 Canada
-
 Chile
Chile
-
 China
China
-
 Colombia
-
 Congo
Congo
-
 Costa Rica
-
 Cote d'Ivoire
-
 Croatia
-
 Cuba
Cuba
-
 Cyprus
-
 Czechia
-
 DR Congo
-
 Denmark
-
 Dominican Republic
-
 Ecuador
-
 Egypt
Egypt
-
 El Salvador
-
 Estonia
-
 Eswatini
-
 Ethiopia
-
 Finland
-
 France
-
 Georgia
-
 Germany
-
 Ghana
Ghana
-
 Greece
-
 Haiti
Haiti
-
 Hong Kong
-
 Hungary
-
 India
India
-
 Indonesia
-
 Iran, Islamic republic
-
 Iraq
Iraq
-
 Ireland
-
 Israel
-
 Italy
Italy
-
 Jamaica
-
 Japan
Japan
-
 Jordan
-
 Kazakhstan
-
 Kenya
Kenya
-
 Korea
Korea
-
 Kuwait
-
 Kyrgyzstan
-
 Laos
Laos
-
 Latvia
-
 Lebanon
-
 Lesotho
-
 Libya
Libya
-
 Lithuania
-
 Luxembourg
-
 Madagascar
-
 Malaysia
-
 Malta
Malta
-
 Mauritius
-
 Mexico
-
 Moldova
-
 Mongolia
-
 Montenegro
-
 Morocco
-
 Mozambique
-
 Myanmar
-
 Namibia
-
 Nepal
Nepal
-
 Netherlands
-
 New Zealand
-
 Nigeria
-
 North Macedonia
-
 Norway
-
 Oman
Oman
-
 Pakistan
-
 Palestine
-
 Panama
-
 Papua New Guinea
-
 Paraguay
-
 Peru
Peru
-
 Philippines
-
 Poland
-
 Portugal
-
 Puerto Rico
-
 Qatar
Qatar
-
 Reunion
-
 Romania
-
 Rwanda
-
 Saudi Arabia
-
 Serbia
-
 Singapore
-
 Slovakia
-
 Slovenia
-
 Somalia
-
 South Africa
-
 Spain
Spain
-
 Sri Lanka
-
 Sweden
-
 Switzerland
-
 Syria
Syria
-
 Taiwan
-
 Tajikistan
-
 Tanzania
-
 Thailand
-
 Trinidad and Tobago
-
 Tunisia
-
 Turkey
-
 UAE
UAE
-
 Uganda
-
 Ukraine
-
 United Kingdom
-
United States
-
 Uruguay
-
 Uzbekistan
-
 Venezuela
-
 Vietnam
-
 Yemen
Yemen
-
 Zambia
-
 Zimbabwe
- Forex
- Crypto
