
SoFi stock declines as shares trade well below the long-term average

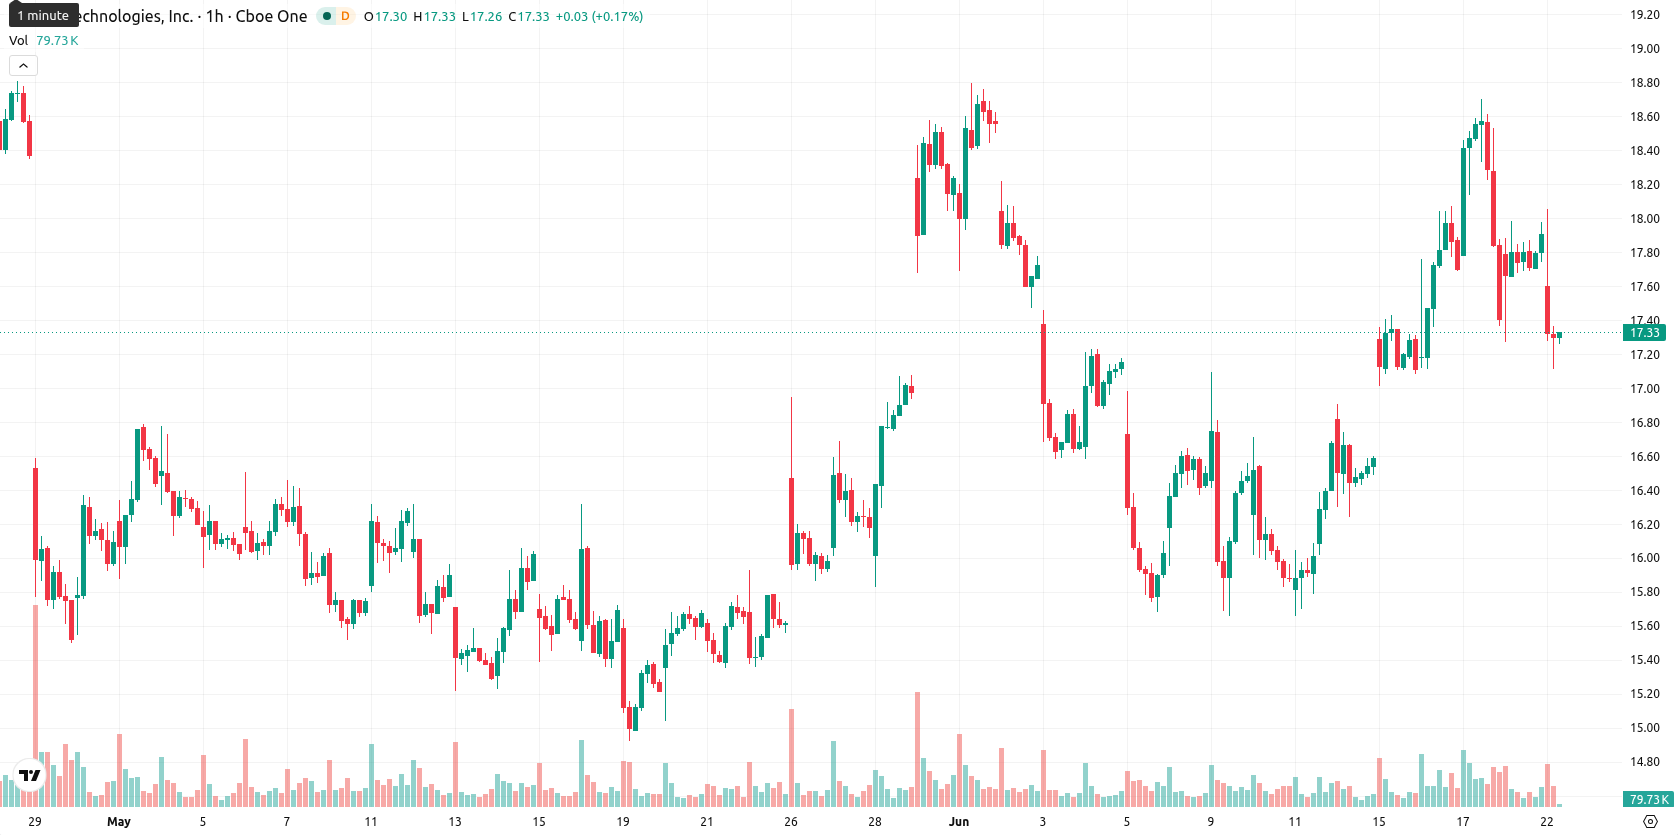
SoFi Technologies, Inc. (SOFI) stock is trading at $17.18 after falling 4.02% on the day. The price sits below its key moving averages according to intraday readings and is under pressure relative to longer timeframes.
Highlights
- SoFi's Q1 2026 net revenue reached $1.10 billion with $166.7 million net income, signaling stable fundamentals despite broader market selling.
- Recent board re-election, executive compensation approval, and $2.25 million insider purchases by the CEO reinforce governance continuity and management alignment.
- SOFI faces near-term downside risk with a projected $16.47–$17.89 range, as technicals indicate seller dominance and trend exhaustion amid volatility.
Insider buying and stable results amid persistent selling pressure
SoFi shareholders re-elected the board of directors and approved executive compensation on June 21, 2026, with Deloitte & Touche retained as auditor for the year, according to Ts2. These actions provide a foundation of corporate governance and continuity but tend to have minimal near-term price impact. Recent developments also included first-quarter 2026 results showing net revenue of $1.10 billion and net income of $166.7 million, alongside a second-quarter dividend announcement and reported insider share purchases totaling $2.25 million this year by CEO Anthony Noto, as reported by Thestreet. All events reflect generally stable or constructive company fundamentals, though price action has remained under broader selling pressure.
Mixed signals as oversold oscillators contrast with resistance at $17.89
On the technical front, SOFI trades below its MA-20 at $17.89 but remains above the MA-50 at $17.15 on the H1 timeframe, while still trading under the long-term MA-200 at $22.7 observed on the daily chart. The Ichimoku Kijun at $17.89 represents immediate resistance. Among oscillators, MACD points to a strong buy, contrasting with a selling signal from ADX; RSI registers at 42.57 with Stoch RSI and CCI both indicating oversold conditions. Bull/Bear Power signals persistent seller control intraday, while the Awesome Oscillator shows no decisive momentum bias.
Slight downside bias as sideways range dominates outlook
In the near term, the expected price range for SOFI is $16.47–$17.89, reflecting typical volatility relative to current levels. There is a slight downside skew with a 52% probability of downward continuation compared to a 48% chance of recovery. The baseline scenario expects the price to move sideways within this corridor, with a potential upside breakout if resistance at $17.89 is cleared or further losses if support at $16.47 fails.
Earlier, analysts noted that SoFi's recent asset-backed securities transactions reflected both the company's substantial credit quality and ongoing vigilance amid elevated default trends. With current price action showing persistent technical pressure and a slight downside bias, traders should closely monitor the $16.47 support level as a potential inflection point for near-term direction.


Latest SoFi News


-
 Afghanistan
-
 Albania
-
 Algeria
-
 Angola
-
 Argentina
-
 Armenia
-
 Australia
-
 Austria
-
 Azerbaijan
-
 Bahamas
-
 Bahrain
-
 Bangladesh
-
 Belarus
-
 Belgium
-
 Bolivia
-
 Botswana
-
 Brazil
-
 Brunei
-
 Bulgaria
-
 Cambodia
-
 Cameroon
-
 Canada
-
 Chile
Chile
-
 China
China
-
 Colombia
-
 Congo
Congo
-
 Costa Rica
-
 Cote d'Ivoire
-
 Croatia
-
 Cuba
Cuba
-
 Cyprus
-
 Czechia
-
 DR Congo
-
 Denmark
-
 Dominican Republic
-
 Ecuador
-
 Egypt
Egypt
-
 El Salvador
-
 Estonia
-
 Eswatini
-
 Ethiopia
-
 Finland
-
 France
-
 Georgia
-
 Germany
-
 Ghana
Ghana
-
 Greece
-
 Haiti
Haiti
-
 Hong Kong
-
 Hungary
-
 India
India
-
 Indonesia
-
 Iran, Islamic republic
-
 Iraq
Iraq
-
 Ireland
-
 Israel
-
 Italy
Italy
-
 Jamaica
-
 Japan
Japan
-
 Jordan
-
 Kazakhstan
-
 Kenya
Kenya
-
 Korea
Korea
-
 Kuwait
-
 Kyrgyzstan
-
 Laos
Laos
-
 Latvia
-
 Lebanon
-
 Lesotho
-
 Libya
Libya
-
 Lithuania
-
 Luxembourg
-
 Madagascar
-
 Malaysia
-
 Malta
Malta
-
 Mauritius
-
 Mexico
-
 Moldova
-
 Mongolia
-
 Montenegro
-
 Morocco
-
 Mozambique
-
 Myanmar
-
 Namibia
-
 Nepal
Nepal
-
 Netherlands
-
 New Zealand
-
 Nigeria
-
 North Macedonia
-
 Norway
-
 Oman
Oman
-
 Pakistan
-
 Palestine
-
 Panama
-
 Papua New Guinea
-
 Paraguay
-
 Peru
Peru
-
 Philippines
-
 Poland
-
 Portugal
-
 Puerto Rico
-
 Qatar
Qatar
-
 Reunion
-
 Romania
-
 Rwanda
-
 Saudi Arabia
-
 Serbia
-
 Singapore
-
 Slovakia
-
 Slovenia
-
 Somalia
-
 South Africa
-
 Spain
Spain
-
 Sri Lanka
-
 Sweden
-
 Switzerland
-
 Syria
Syria
-
 Taiwan
-
 Tajikistan
-
 Tanzania
-
 Thailand
-
 Trinidad and Tobago
-
 Tunisia
-
 Turkey
-
 UAE
UAE
-
 Uganda
-
 Ukraine
-
 United Kingdom
-
United States
-
 Uruguay
-
 Uzbekistan
-
 Venezuela
-
 Vietnam
-
 Yemen
Yemen
-
 Zambia
-
 Zimbabwe
- Forex
- Crypto
