
TSLA shares trade near the bottom of the recent range as volatility surges: weekly review

Tesla, Inc. (TSLA) finished the week at $315.97, recording a sharp decline of $64.28 or 16.90%. The share price is well below the weekly MA-20 at $389.31 and MA-50 at $406.82, underscoring sustained selling pressure, but it remains above the MA-200 at $282.56, signaling that long-term support is still intact.
 311.68
384.07
311.68
384.07
Highlights
- Tesla shares are under strong medium-term selling pressure, trading well below key moving averages but above long-term support.
- Technical indicators confirm a decisive bearish trend, with momentum, trend strength, and oscillators all signaling heightened downside risk.
- The expected 7-day price corridor is $307.50–$323.50, with a high probability of continued weakness and volatility remaining elevated.
Record revenue and deliveries offset by margin erosion and cash outflow
Tesla reported Q2 2026 earnings with record revenues of $28.24 billion and the highest-ever quarterly vehicle deliveries at 480,126 units, though profitability was pressured by increased operating expenses and high investment in AI and robotics. Operating margin fell to 1.4% and the company recorded negative free cash flow, marking the first time in over two years. Additional developments included regulator action on vehicle door systems and the broad deployment of new Full Self-Driving software and AI-powered features.
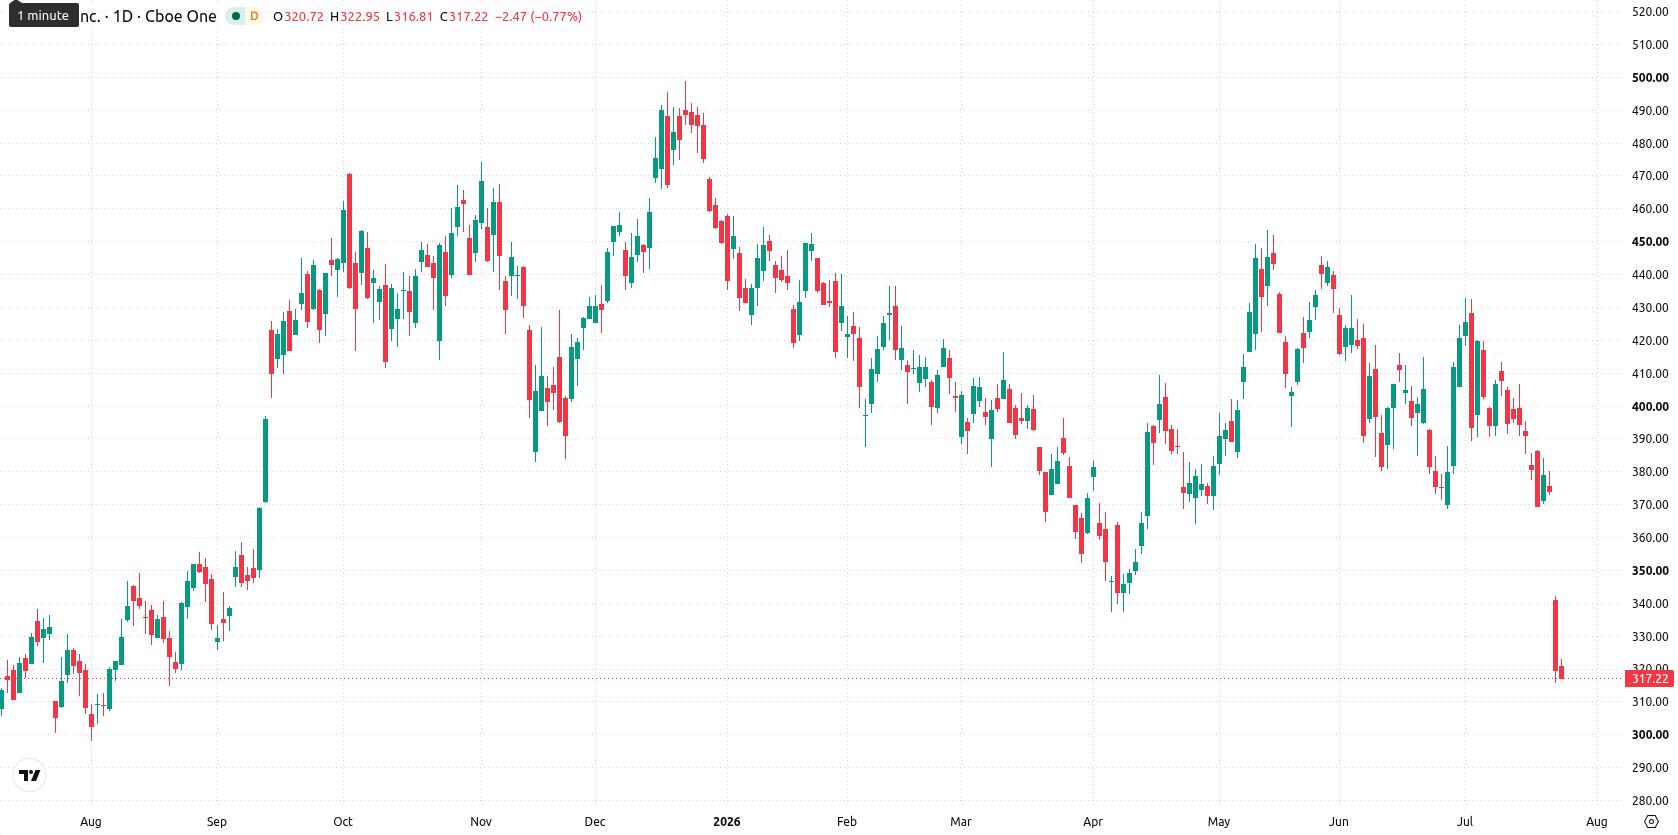
Oversold momentum and weak trend persist as volatility surges this week
Weekly technical momentum for TSLA remains bearish. The price closed well below the MA-20 and MA-50, reflecting persistent weakness, while sitting above the MA-200, which acts as long-term structural support. The MACD is negative, and the ADX at 10.44 signals a lack of strong directional trend. Both RSI (36.67) and Stochastic RSI are oversold, with the CCI also deep in oversold territory, highlighting a stretched downside move but no clear reversal. Bull/Bear Power (–3.04) favors sellers, supported by a negative Awesome Oscillator. TSLA ended the week at the bottom of its weekly range with high volatility at 22.37%, pointing to a turbulent period.
Range-bound trade likely next week amid low odds of bullish reversal
For the next 5 trading days, TSLA is expected to remain volatile within a price corridor of $307.50 – $323.50, according to the weekly indicators and recent volatility. There is a strong likelihood of continued sideways or mildly bearish action, with a low probability (less than 20%) of an upward move while none of the main weekly indicators signal a Buy. The baseline scenario is further consolidation near oversold levels. Potential downside below $307.50 could lead to further weakness, while a recovery above $323.50 appears unlikely unless momentum shifts significantly.
Earlier, analysts noted that sustained selling in Tesla shares followed weak earnings and persistent concerns over profitability, overshadowing advancements in autonomous technology. The latest technical signals and volatility suggest that the prevailing scenario remains one of caution, with traders watching for potential downside risk if TSLA falls below $307.50 in the coming week.


Latest Tesla News







-
 Afghanistan
-
 Albania
-
 Algeria
-
 Angola
-
 Argentina
-
 Armenia
-
 Australia
-
 Austria
-
 Azerbaijan
-
 Bahamas
-
 Bahrain
-
 Bangladesh
-
 Belarus
-
 Belgium
-
 Bolivia
-
 Botswana
-
 Brazil
-
 Brunei
-
 Bulgaria
-
 Cambodia
-
 Cameroon
-
 Canada
-
 Chile
Chile
-
 China
China
-
 Colombia
-
 Congo
Congo
-
 Costa Rica
-
 Cote d'Ivoire
-
 Croatia
-
 Cuba
Cuba
-
 Cyprus
-
 Czechia
-
 DR Congo
-
 Denmark
-
 Dominican Republic
-
 Ecuador
-
 Egypt
Egypt
-
 El Salvador
-
 Estonia
-
 Eswatini
-
 Ethiopia
-
 Finland
-
 France
-
 Georgia
-
 Germany
-
 Ghana
Ghana
-
 Greece
-
 Haiti
Haiti
-
 Hong Kong
-
 Hungary
-
 India
India
-
 Indonesia
-
 Iran, Islamic republic
-
 Iraq
Iraq
-
 Ireland
-
 Israel
-
 Italy
Italy
-
 Jamaica
-
 Japan
Japan
-
 Jordan
-
 Kazakhstan
-
 Kenya
Kenya
-
 Korea
Korea
-
 Kuwait
-
 Kyrgyzstan
-
 Laos
Laos
-
 Latvia
-
 Lebanon
-
 Lesotho
-
 Libya
Libya
-
 Lithuania
-
 Luxembourg
-
 Madagascar
-
 Malaysia
-
 Malta
Malta
-
 Mauritius
-
 Mexico
-
 Moldova
-
 Mongolia
-
 Montenegro
-
 Morocco
-
 Mozambique
-
 Myanmar
-
 Namibia
-
 Nepal
Nepal
-
 Netherlands
-
 New Zealand
-
 Nigeria
-
 North Macedonia
-
 Norway
-
 Oman
Oman
-
 Pakistan
-
 Palestine
-
 Panama
-
 Papua New Guinea
-
 Paraguay
-
 Peru
Peru
-
 Philippines
-
 Poland
-
 Portugal
-
 Puerto Rico
-
 Qatar
Qatar
-
 Reunion
-
 Romania
-
 Rwanda
-
 Saudi Arabia
-
 Serbia
-
 Singapore
-
 Slovakia
-
 Slovenia
-
 Somalia
-
 South Africa
-
 Spain
Spain
-
 Sri Lanka
-
 Sweden
-
 Switzerland
-
 Syria
Syria
-
 Taiwan
-
 Tajikistan
-
 Tanzania
-
 Thailand
-
 Trinidad and Tobago
-
 Tunisia
-
 Turkey
-
 UAE
UAE
-
 Uganda
-
 Ukraine
-
 United Kingdom
-
United States
-
 Uruguay
-
 Uzbekistan
-
 Venezuela
-
 Vietnam
-
 Yemen
Yemen
-
 Zambia
-
 Zimbabwe
- Forex
- Crypto












