

JetBlue Airways stock tests $6.56 resistance: Resistance levels in focus

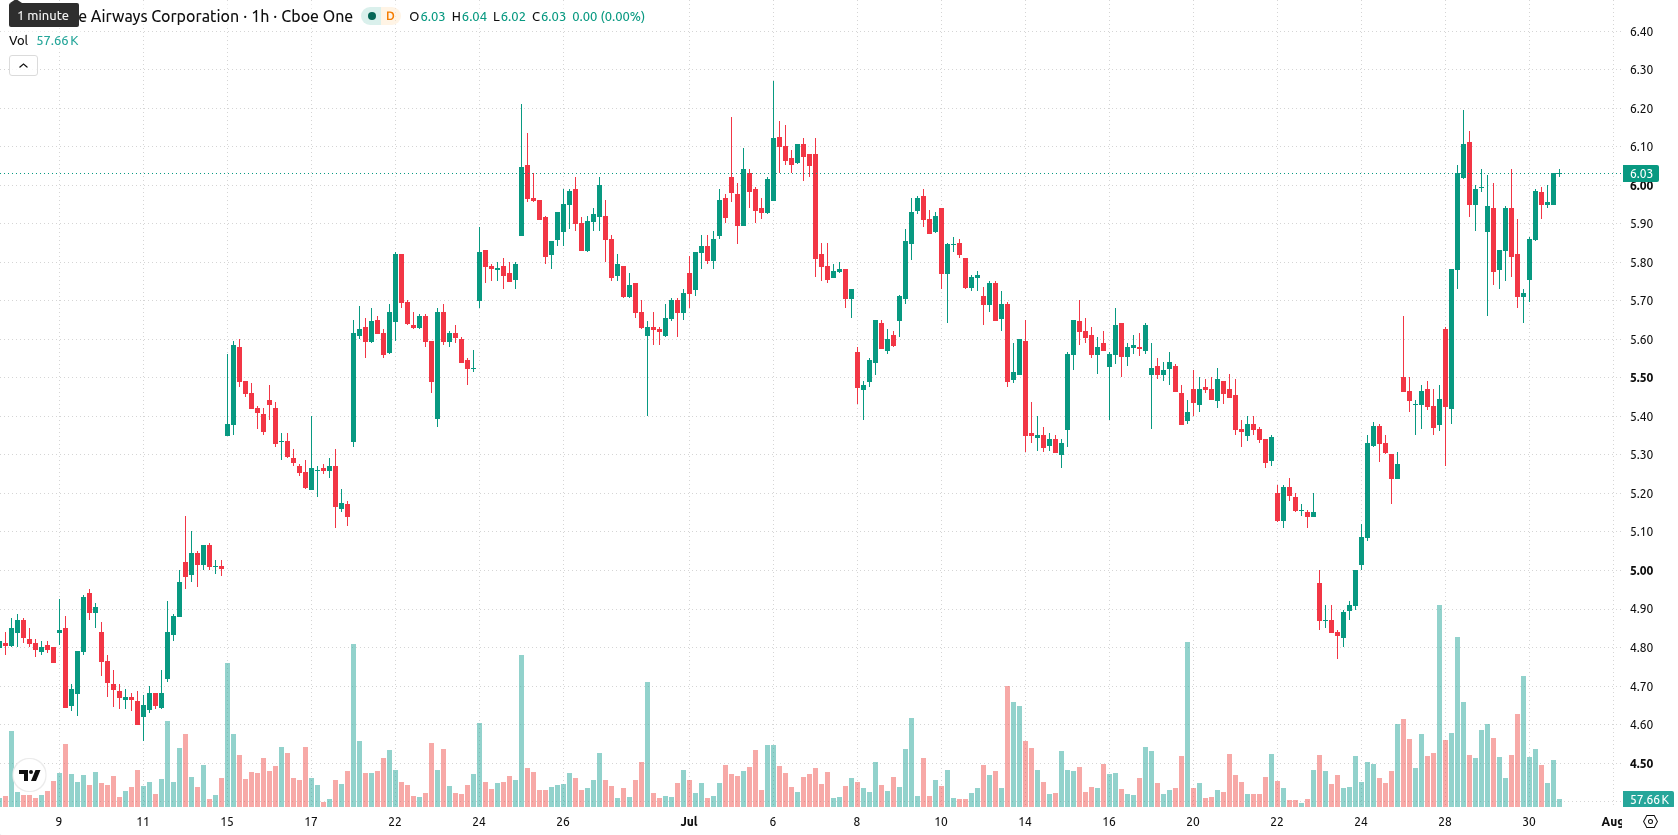
JetBlue Airways (JBLU) stock is trading at $6.03, up 5.42% on the day. The price is positioned above its key short- and long-term moving averages at current levels.
 3.64
4.03
3.64
4.03
Highlights
- JetBlue reported a $247 million Q2 net loss as an 80.7% surge in fuel costs offset 14.5% revenue growth to $2.70 billion.
- The airline is targeting higher-margin segments and regional expansion by upgrading premium cabin offerings and increasing Fort Lauderdale routes.
- JBLU trades in a strong bullish technical structure with high momentum, projecting a $5.50–$6.56 trading range and very high upside probability in the near term.
Margins pressured as surging fuel costs offset revenue growth
JetBlue Airways reported a net loss of US$247 million for the second quarter of 2026, as an 80.7% increase in fuel costs significantly narrowed margins amid 14.5% year-over-year revenue growth to around US$2.70 billion, according to Airwaysmag. This operational result underscores ongoing cost pressures, but the strong revenue performance points to resilient demand for the carrier’s services. The airline is also improving its premium product portfolio by partnering with Crown Shy and Birdee for a new Mint cabin menu, while introducing new cabin categories and expanding its Fort Lauderdale route network to strengthen regional connectivity and attract additional customers.
Momentum intact as technical signals back sustained buying activity
On the technical front, JBLU is trading above the MA-20 at $5.86, MA-50 at $5.46, and the long-term MA-200 at $4.98 on the hourly chart. The Ichimoku Kijun currently marks immediate support at $5.74. MACD displays a Strong Buy, while ADX signals strong trend momentum; RSI is at 61.71 and suggests ongoing buying interest. CCI and Stoch RSI both remain neutral to positive, and Bull/Bear Power points to clear buyer dominance intraday. The Awesome Oscillator further supports the prevailing upward momentum, with no major divergences between oscillators. Price action ended the session near today’s high following a period of increased volatility and sustained intraday momentum.
High probability of upside as volatility narrows short-term risks
For the short term (the next 2–3 trading days), JBLU is expected to trade within a typical volatility band of $5.5 to $6.56. The probability of an upward move is very high, while downside risks appear minimal. The baseline scenario involves sideways consolidation within this range; a bullish breakout above resistance could extend gains, whereas a loss of support may prompt a retracement.
Earlier, analysts noted that JetBlue Airways was exhibiting renewed bullish momentum on the back of operational improvements and resilient revenue trends. The current set-up reinforces this positive momentum, with strong technical signals and robust demand positioning JBLU for potential upside as it approaches key resistance within a narrowing volatility band.









-
 Afghanistan
-
 Albania
-
 Algeria
-
 Angola
-
 Argentina
-
 Armenia
-
 Australia
-
 Austria
-
 Azerbaijan
-
 Bahamas
-
 Bahrain
-
 Bangladesh
-
 Belarus
-
 Belgium
-
 Bolivia
-
 Botswana
-
 Brazil
-
 Brunei
-
 Bulgaria
-
 Cambodia
-
 Cameroon
-
 Canada
-
 Chile
Chile
-
 China
China
-
 Colombia
-
 Congo
Congo
-
 Costa Rica
-
 Cote d'Ivoire
-
 Croatia
-
 Cuba
Cuba
-
 Cyprus
-
 Czechia
-
 DR Congo
-
 Denmark
-
 Dominican Republic
-
 Ecuador
-
 Egypt
Egypt
-
 El Salvador
-
 Estonia
-
 Eswatini
-
 Ethiopia
-
 Finland
-
 France
-
 Georgia
-
 Germany
-
 Ghana
Ghana
-
 Greece
-
 Haiti
Haiti
-
 Hong Kong
-
 Hungary
-
 India
India
-
 Indonesia
-
 Iran, Islamic republic
-
 Iraq
Iraq
-
 Ireland
-
 Israel
-
 Italy
Italy
-
 Jamaica
-
 Japan
Japan
-
 Jordan
-
 Kazakhstan
-
 Kenya
Kenya
-
 Korea
Korea
-
 Kuwait
-
 Kyrgyzstan
-
 Laos
Laos
-
 Latvia
-
 Lebanon
-
 Lesotho
-
 Libya
Libya
-
 Lithuania
-
 Luxembourg
-
 Madagascar
-
 Malaysia
-
 Malta
Malta
-
 Mauritius
-
 Mexico
-
 Moldova
-
 Mongolia
-
 Montenegro
-
 Morocco
-
 Mozambique
-
 Myanmar
-
 Namibia
-
 Nepal
Nepal
-
 Netherlands
-
 New Zealand
-
 Nigeria
-
 North Macedonia
-
 Norway
-
 Oman
Oman
-
 Pakistan
-
 Palestine
-
 Panama
-
 Papua New Guinea
-
 Paraguay
-
 Peru
Peru
-
 Philippines
-
 Poland
-
 Portugal
-
 Puerto Rico
-
 Qatar
Qatar
-
 Reunion
-
 Romania
-
 Rwanda
-
 Saudi Arabia
-
 Serbia
-
 Singapore
-
 Slovakia
-
 Slovenia
-
 Somalia
-
 South Africa
-
 Spain
Spain
-
 Sri Lanka
-
 Sweden
-
 Switzerland
-
 Syria
Syria
-
 Taiwan
-
 Tajikistan
-
 Tanzania
-
 Thailand
-
 Trinidad and Tobago
-
 Tunisia
-
 Turkey
-
 UAE
UAE
-
 Uganda
-
 Ukraine
-
 United Kingdom
-
United States
-
 Uruguay
-
 Uzbekistan
-
 Venezuela
-
 Vietnam
-
 Yemen
Yemen
-
 Zambia
-
 Zimbabwe
- Forex
- Crypto












