

Tesla stock holds near $409.94 resistance as FSD subscriptions reach 1.5 million users

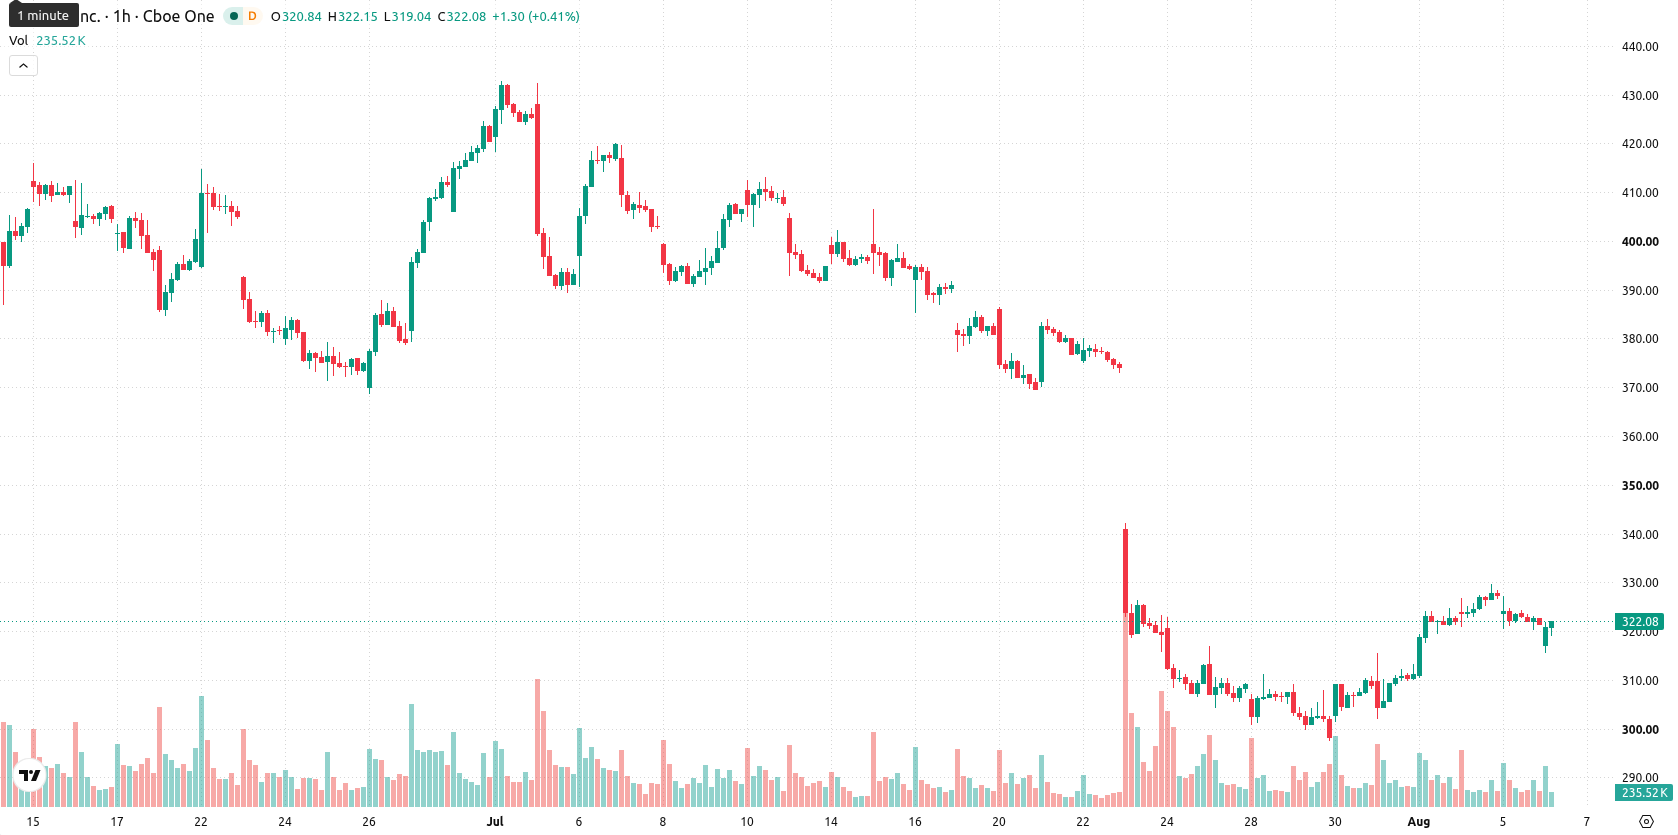
Tesla (TSLA) stock is trading at $321.29, marking a marginal upward move on the day. The price is currently positioned below its key short-term moving averages but remains above some medium-term levels.
 410.85
Highlights
- Tesla reported record Q2 2026 deliveries of 480,126 vehicles, achieving its first $100 billion trailing twelve-month revenue milestone.
- Profitability fell, with GAAP operating income dropping 57% and margins pressured by a 47% surge in expenses and ongoing safety investigations.
- TSLA stock exhibits mixed technical signals and trades in a $309.05 to $333.53 range, with a slight bearish tilt and volatility driven by seller dominance.
Earnings record drives revenue gains amid margin compression and FSD expansion
Tesla’s Q2 2026 earnings revealed record deliveries of 480,126 vehicles and marked the company’s first time surpassing $100 billion in trailing twelve-month revenue, according to Fool. Despite this scale, profitability came under pressure as GAAP operating income declined 57% and margins narrowed due to a sharp 47% rise in expenses. Blockonomi reported that Full Self-Driving subscriptions hit 1.5 million users, adding nearly $2 billion in annualized recurring revenue, while regulatory developments in the Netherlands expanded FSD authorization but also raised transparency concerns. Additional context includes ongoing U.S. government and NHTSA investigations into vehicle safety cited by Driving, and Tesla’s production of its 10-millionth vehicle in Fremont as noted by Teslaoracle.
Mixed momentum signals as price straddles short- and medium-term supports
TSLA currently trades below its MA-20 at $323.79, which signals immediate seller pressure, but stands above the MA-50 at $313.98. The price remains far beneath the MA-200 at $409.94, indicating lasting technical challenges, while the Ichimoku Kijun at $319.61 offers initial support. Momentum indicators are mixed: MACD signals a Strong Buy, ADX is also in Buy territory, and RSI reads 51.41, but Stoch RSI, CCI, and Bull/Bear Power all point to oversold conditions, favoring sellers. Awesome Oscillator is neutral, and there is a notable divergence between strong momentum readings and oversold oscillators, highlighting ongoing market indecision.
Breakout risk balanced as range persists near volatility band
In the short term, TSLA is likely to remain rangebound between $309.05 and $333.53, reflecting a typical volatility band relative to current levels. The probability of an upside breakout is estimated at 46%, with a 54% likelihood of a downward move. If bullish momentum builds, the price could test immediate resistance and approach the upper end of the forecast range. Conversely, a breakdown below $319.61 would open the path toward the lower bound of the band.
Earlier, analysts noted that volatility in Tesla shares could be heightened by broader activity in other Musk-linked companies but judged the company’s fundamental outlook to remain intact. With new earnings and technical data now in focus, traders should monitor the $319.61 level, as a decisive move below this support could shift the prevailing balance of risk toward a further retracement within the current trading band.











-
 Afghanistan
-
 Albania
-
 Algeria
-
 Angola
-
 Argentina
-
 Armenia
-
 Australia
-
 Austria
-
 Azerbaijan
-
 Bahamas
-
 Bahrain
-
 Bangladesh
-
 Belarus
-
 Belgium
-
 Bolivia
-
 Botswana
-
 Brazil
-
 Brunei
-
 Bulgaria
-
 Cambodia
-
 Cameroon
-
 Canada
-
 Chile
-
 China
-
 Colombia
-
 Congo
-
 Costa Rica
-
 Cote d'Ivoire
-
 Croatia
-
 Cuba
-
 Cyprus
-
 Czechia
-
 DR Congo
-
 Denmark
-
 Dominican Republic
-
 Ecuador
-
 Egypt
-
 El Salvador
-
 Estonia
-
 Eswatini
-
 Ethiopia
-
 Finland
-
 France
-
 Georgia
-
 Germany
-
 Ghana
-
 Greece
-
 Haiti
-
 Hong Kong
-
 Hungary
-
 India
-
 Indonesia
-
 Iran, Islamic republic
-
 Iraq
-
 Ireland
-
 Israel
-
 Italy
-
 Jamaica
-
 Japan
-
 Jordan
-
 Kazakhstan
-
 Kenya
-
 Korea
-
 Kuwait
-
 Kyrgyzstan
-
 Laos
-
 Latvia
-
 Lebanon
-
 Lesotho
-
 Libya
-
 Lithuania
-
 Luxembourg
-
 Madagascar
-
 Malaysia
-
 Malta
-
 Mauritius
-
 Mexico
-
 Moldova
-
 Mongolia
-
 Montenegro
-
 Morocco
-
 Mozambique
-
 Myanmar
-
 Namibia
-
 Nepal
-
 Netherlands
-
 New Zealand
-
 Nigeria
-
 North Macedonia
-
 Norway
-
 Oman
-
 Pakistan
-
 Palestine
-
 Panama
-
 Papua New Guinea
-
 Paraguay
-
 Peru
-
 Philippines
-
 Poland
-
 Portugal
-
 Puerto Rico
-
 Qatar
-
 Reunion
-
 Romania
-
 Rwanda
-
 Saudi Arabia
-
 Serbia
-
 Singapore
-
 Slovakia
-
 Slovenia
-
 Somalia
-
 South Africa
-
 Spain
-
 Sri Lanka
-
 Sweden
-
 Switzerland
-
 Syria
-
 Taiwan
-
 Tajikistan
-
 Tanzania
-
 Thailand
-
 Trinidad and Tobago
-
 Tunisia
-
 Turkey
-
 UAE
-
 Uganda
-
 Ukraine
-
 United Kingdom
-
United States
-
 Uruguay
-
 Uzbekistan
-
 Venezuela
-
 Vietnam
-
 Yemen
-
 Zambia
-
 Zimbabwe
- Forex
- Crypto












