

Eli Lilly stock weekly forecast: Recent surge supported by strong Q2 results and obesity treatment momentum

Shares of Eli Lilly and Company (LLY) are trading near $1,214, rising around 2.5% over the past week as the recovery holds momentum. The move was driven by robust corporate news that has underpinned demand, even as technical signals grow stretched. With the week ahead, traders will be watching to see if LLY can sustain its gains or faces pressure from its overbought setup.
 1421.99
1436.72
Highlights
- Shares of Eli Lilly advanced 2.5% over the past week to $1,214, maintaining a bullish long-term structure.
- Price action is consolidating near the upper end of the weekly range with volatility at 5.37% and mixed momentum indicators.
- Expected range for the week is $1,161 to $1,242, with support at $1,179 and resistance at $1,235.
Record revenue and obesity drug growth drive momentum over the week
Eli Lilly posted strong second-quarter 2026 results, with revenue reaching $22.97 billion, up 47.7% year over year, and raised its full-year 2026 revenue outlook to $85 billion–$87 billion, according to CNBC and Yahoo Finance. The performance was supported by rapid growth in its obesity treatments, particularly Mounjaro and the approval of the new oral GLP-1 pill Foundayo, for which the UK regulator granted marketing authorization on August 10, 2026. Additional initiatives such as the U.S. launch of Employer Connect, expanding access to Zepbound, signal continued momentum for the week ahead.
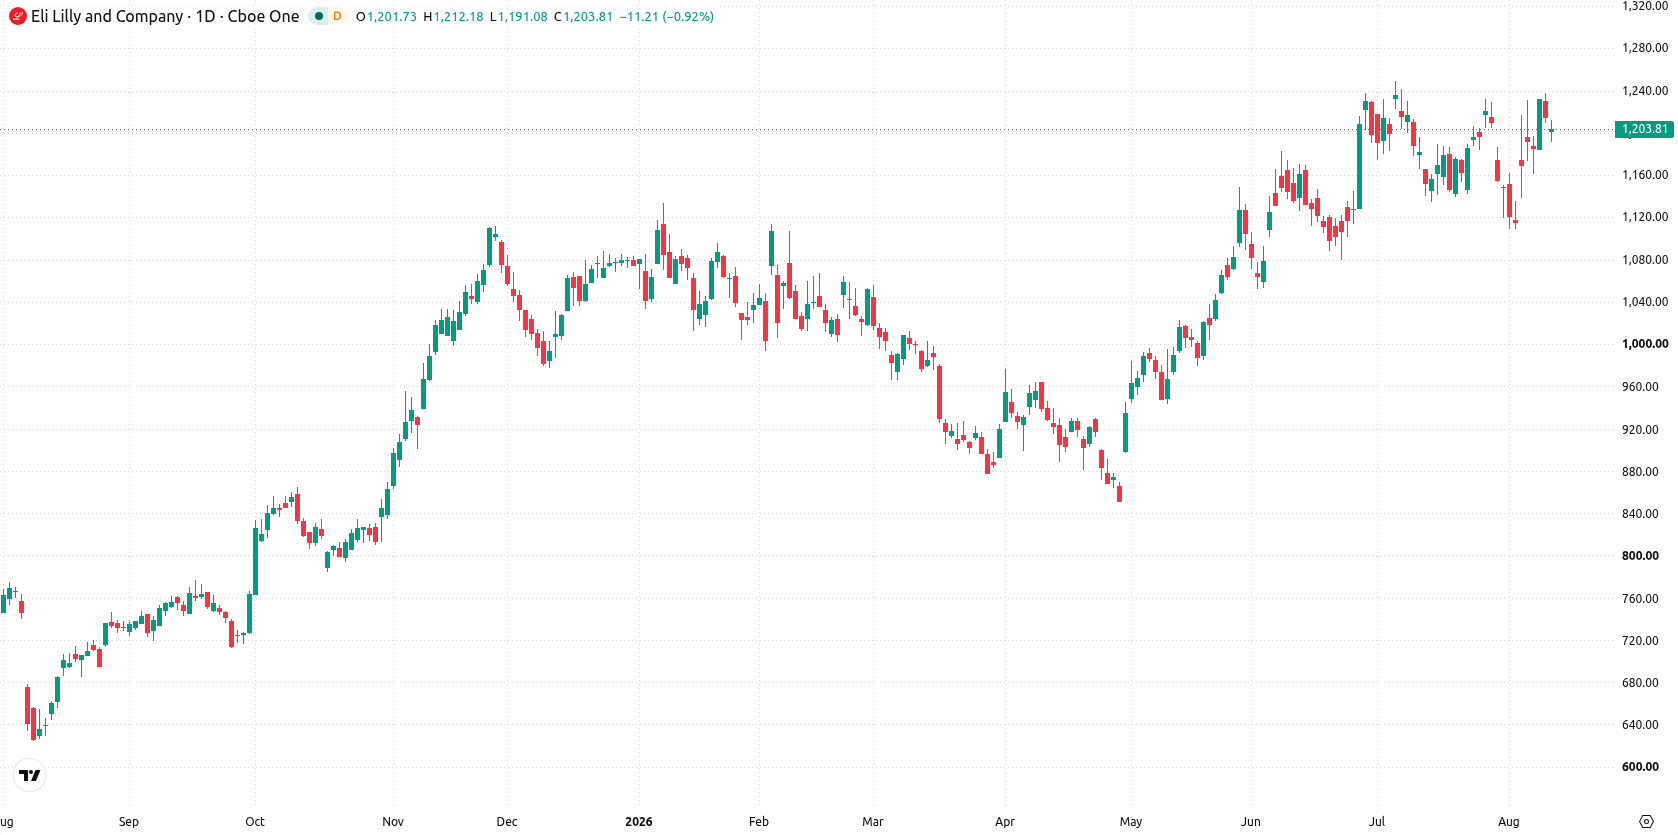
Narrow consolidation as technical signals turn mixed during the week
The daily chart shows Eli Lilly holding a contained move within a narrow range, with volatility over the past week at 5.37%. The MACD remains in buy territory, but momentum signals are conflicted, as the CCI stands overbought at 123.23 while the RSI is neutral at 57.27. The nearest support is marked by the Ichimoku Kijun at $1,179 and resistance sits at $1,235. With price action consolidating near the upper end of its weekly range, the setup suggests cautious upside, but the overbought signal calls for attention to possible short-term pullbacks.
Bullish bias with breakout risk as consolidation persists next week
For the coming trading week, the expected range is $1,161 to $1,242, with a 75% probability of an increase and a 25% probability of a decrease. The base case is for Eli Lilly to continue consolidating between $1,179 and $1,235. A bullish breakout above $1,235 would open the possibility for a test of $1,242. A drop below $1,179 support could see further downside toward $1,161.
Earlier, analysts noted that Eli Lilly maintained a bullish technical structure, supported by strong earnings and upward guidance revisions. The latest results further strengthen this view, with new product launches and an improved outlook underscoring that a sustained move beyond $1,235 could signal the next phase of upside momentum.






Latest Eli Lilly and Company News




-
 Afghanistan
-
 Albania
-
 Algeria
-
 Angola
-
 Argentina
-
 Armenia
-
 Australia
-
 Austria
-
 Azerbaijan
-
 Bahamas
-
 Bahrain
-
 Bangladesh
-
 Belarus
-
 Belgium
-
 Bolivia
-
 Botswana
-
 Brazil
-
 Brunei
-
 Bulgaria
-
 Cambodia
-
 Cameroon
-
 Canada
-
 Chile
-
 China
-
 Colombia
-
 Congo
-
 Costa Rica
-
 Cote d'Ivoire
-
 Croatia
-
 Cuba
-
 Cyprus
-
 Czechia
-
 DR Congo
-
 Denmark
-
 Dominican Republic
-
 Ecuador
-
 Egypt
-
 El Salvador
-
 Estonia
-
 Eswatini
-
 Ethiopia
-
 Finland
-
 France
-
 Georgia
-
 Germany
-
 Ghana
-
 Greece
-
 Haiti
-
 Hong Kong
-
 Hungary
-
 India
-
 Indonesia
-
 Iran, Islamic republic
-
 Iraq
-
 Ireland
-
 Israel
-
 Italy
-
 Jamaica
-
 Japan
-
 Jordan
-
 Kazakhstan
-
 Kenya
-
 Korea
-
 Kuwait
-
 Kyrgyzstan
-
 Laos
-
 Latvia
-
 Lebanon
-
 Lesotho
-
 Libya
-
 Lithuania
-
 Luxembourg
-
 Madagascar
-
 Malaysia
-
 Malta
-
 Mauritius
-
 Mexico
-
 Moldova
-
 Mongolia
-
 Montenegro
-
 Morocco
-
 Mozambique
-
 Myanmar
-
 Namibia
-
 Nepal
-
 Netherlands
-
 New Zealand
-
 Nigeria
-
 North Macedonia
-
 Norway
-
 Oman
-
 Pakistan
-
 Palestine
-
 Panama
-
 Papua New Guinea
-
 Paraguay
-
 Peru
-
 Philippines
-
 Poland
-
 Portugal
-
 Puerto Rico
-
 Qatar
-
 Reunion
-
 Romania
-
 Rwanda
-
 Saudi Arabia
-
 Serbia
-
 Singapore
-
 Slovakia
-
 Slovenia
-
 Somalia
-
 South Africa
-
 Spain
-
 Sri Lanka
-
 Sweden
-
 Switzerland
-
 Syria
-
 Taiwan
-
 Tajikistan
-
 Tanzania
-
 Thailand
-
 Trinidad and Tobago
-
 Tunisia
-
 Turkey
-
 UAE
-
 Uganda
-
 Ukraine
-
 United Kingdom
-
United States
-
 Uruguay
-
 Uzbekistan
-
 Venezuela
-
 Vietnam
-
 Yemen
-
 Zambia
-
 Zimbabwe
- Forex
- Crypto












