

Dutch Bros stock support test: Downside targets to watch

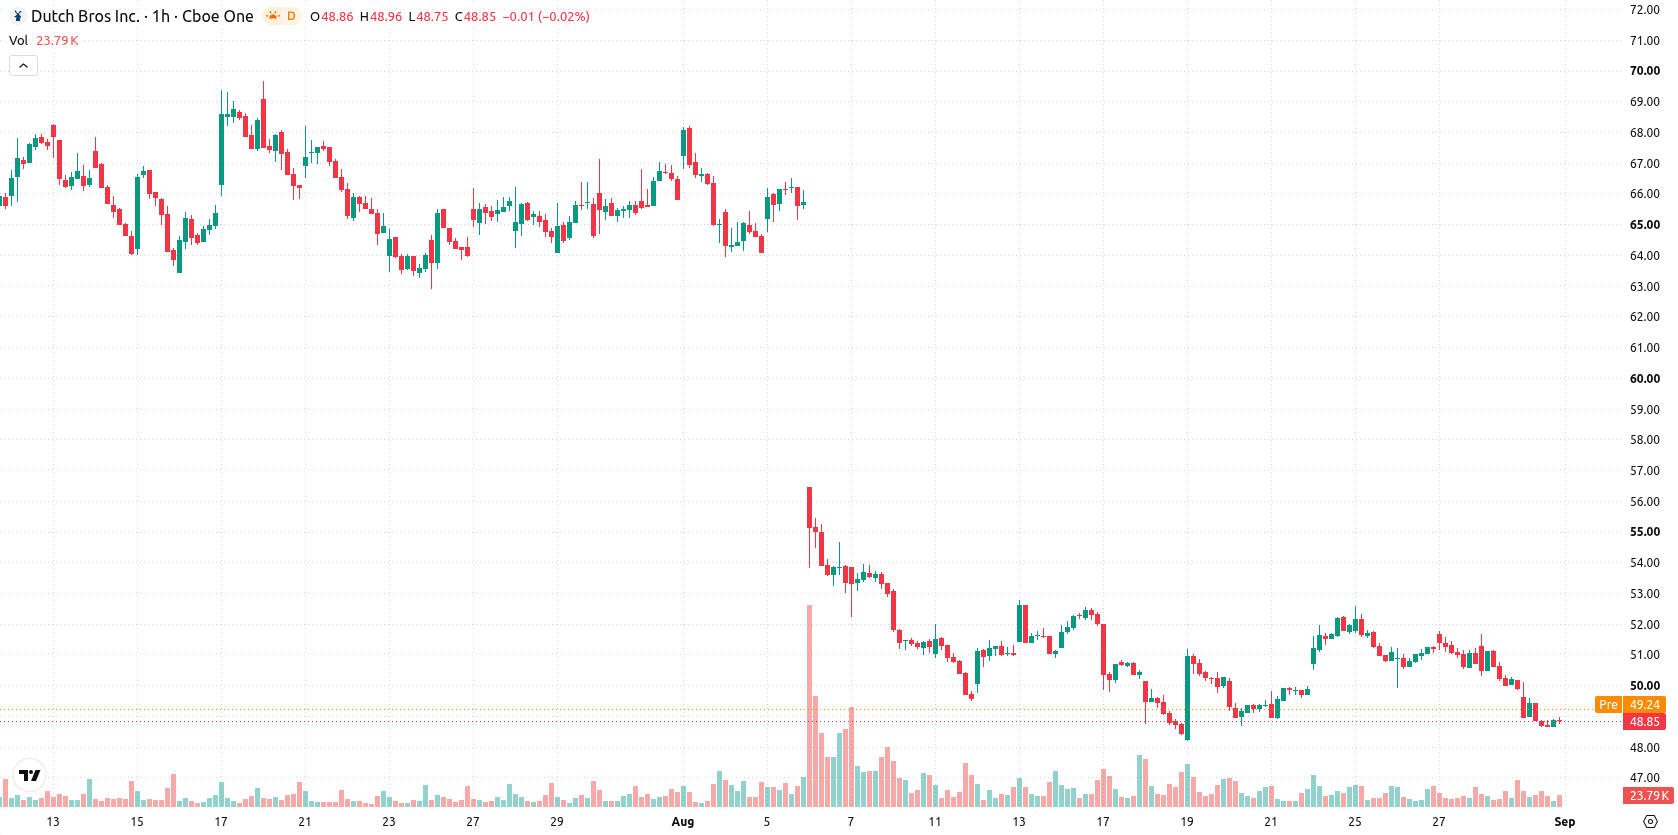
Dutch Bros (BROS) stock is trading at $48.86 after slipping 2.08% on the day, with the price positioned well below its key moving averages to indicate persistent weakness.
 44.97
44.97
Highlights
- BROS/USD stock trades below key short, medium, and long-term moving averages with pronounced seller pressure across all timeframes.
- Negative momentum dominates with bearish signals from MACD, ADX, and low RSI, while oscillators indicate oversold conditions and possible near-term pause.
- Forecast range for the next two to three days is $47.11 to $50.61, with downside moves more probable barring a break above immediate resistance.
Bearish momentum as indicators signal entrenched seller control
On the technical side, BROS/USD remains sharply below the MA-20 at $50.04, MA-50 at $50.55, and the longer-term MA-200 at $57.35. The Ichimoku Kijun is set at $50.19, acting as immediate resistance. The MACD and ADX both signal a negative trend, with the RSI at 34.71 confirming persistent selling momentum. Stochastic RSI, CCI, and Bull/Bear Power all register oversold or dominant seller conditions intraday. The Awesome Oscillator is neutral and does not offer further confirmation.
Sideways bias prevails as breakdown risk outweighs rebound scenario
Looking ahead, BROS is expected to fluctuate between $47.11 and $50.61 over the next two to three sessions, capturing the typical volatility band relative to current levels. The probability of a rebound toward the upper end is 29%, while a breakdown below support is notably more likely. Baseline scenario is sideways action within the band. If price breaks above $50.19, a push toward the upper forecast band is possible; if it falls through $47.11 support, additional weakness is likely.
Earlier, analysts noted that Dutch Bros stock was likely to remain under pressure amid ongoing selling momentum and a cautious technical outlook. The latest price action reinforces this downside bias, with traders now advised to closely monitor the $47.11 support level as a potential trigger for further weakness.










-
 Afghanistan
-
 Albania
-
 Algeria
-
 Angola
-
 Argentina
-
 Armenia
-
 Australia
-
 Austria
-
 Azerbaijan
-
 Bahamas
-
 Bahrain
-
 Bangladesh
-
 Belarus
-
 Belgium
-
 Bolivia
-
 Botswana
-
 Brazil
-
 Brunei
-
 Bulgaria
-
 Cambodia
-
 Cameroon
-
 Canada
-
 Chile
-
 China
-
 Colombia
-
 Congo
-
 Costa Rica
-
 Cote d'Ivoire
-
 Croatia
-
 Cuba
-
 Cyprus
-
 Czechia
-
 DR Congo
-
 Denmark
-
 Dominican Republic
-
 Ecuador
-
 Egypt
-
 El Salvador
-
 Estonia
-
 Eswatini
-
 Ethiopia
-
 Finland
-
 France
-
 Georgia
-
 Germany
-
 Ghana
-
 Greece
-
 Haiti
-
 Hong Kong
-
 Hungary
-
 India
-
 Indonesia
-
 Iran, Islamic republic
-
 Iraq
-
 Ireland
-
 Israel
-
 Italy
-
 Jamaica
-
 Japan
-
 Jordan
-
 Kazakhstan
-
 Kenya
-
 Korea
-
 Kuwait
-
 Kyrgyzstan
-
 Laos
-
 Latvia
-
 Lebanon
-
 Lesotho
-
 Libya
-
 Lithuania
-
 Luxembourg
-
 Madagascar
-
 Malaysia
-
 Malta
-
 Mauritius
-
 Mexico
-
 Moldova
-
 Mongolia
-
 Montenegro
-
 Morocco
-
 Mozambique
-
 Myanmar
-
 Namibia
-
 Nepal
-
 Netherlands
-
 New Zealand
-
 Nigeria
-
 North Macedonia
-
 Norway
-
 Oman
-
 Pakistan
-
 Palestine
-
 Panama
-
 Papua New Guinea
-
 Paraguay
-
 Peru
-
 Philippines
-
 Poland
-
 Portugal
-
 Puerto Rico
-
 Qatar
-
 Reunion
-
 Romania
-
 Rwanda
-
 Saudi Arabia
-
 Serbia
-
 Singapore
-
 Slovakia
-
 Slovenia
-
 Somalia
-
 South Africa
-
 Spain
-
 Sri Lanka
-
 Sweden
-
 Switzerland
-
 Syria
-
 Taiwan
-
 Tajikistan
-
 Tanzania
-
 Thailand
-
 Trinidad and Tobago
-
 Tunisia
-
 Turkey
-
 UAE
-
 Uganda
-
 Ukraine
-
 United Kingdom
-
United States
-
 Uruguay
-
 Uzbekistan
-
 Venezuela
-
 Vietnam
-
 Yemen
-
 Zambia
-
 Zimbabwe
- Forex
- Crypto












