

SoFi stock outlook: Seller pressure points to more downside

SoFi Technologies, Inc. (SOFI) stock is trading at $17.34 after sliding 3.05% today, with shares sitting below key moving averages on the hourly chart.
 16.97
17.63
Highlights
- Fee-based revenue constitutes 39% of SoFi Technologies total income, reducing exposure to lending margin volatility through business model diversification.
- SoFi advances cross-sold products and fee-based financial services to expand customer engagement and further shift away from interest income.
- Shares of SoFi declined 3.05% to $17.34, with technical indicators confirming sustained seller control and a probable range of $16.48 to $18.2 in the near term.
Non-interest revenue growth diversifies earnings amid product expansion
Fee-based revenue comprised 39% of SoFi Technologies, Inc.'s total income, as reported by Seekingalpha, reflecting a strategic shift toward non-interest income sources and supported by the Loan Platform Business. This diversification helps to mitigate balance sheet risk and partially insulates earnings from fluctuations in lending margins. According to Finance Yahoo, SoFi has also advanced its expansion of cross-sold products and fee-based financial services, which broadens its business model and increases customer engagement. These developments indicate ongoing business transformation, though price action has remained under broader selling pressure.
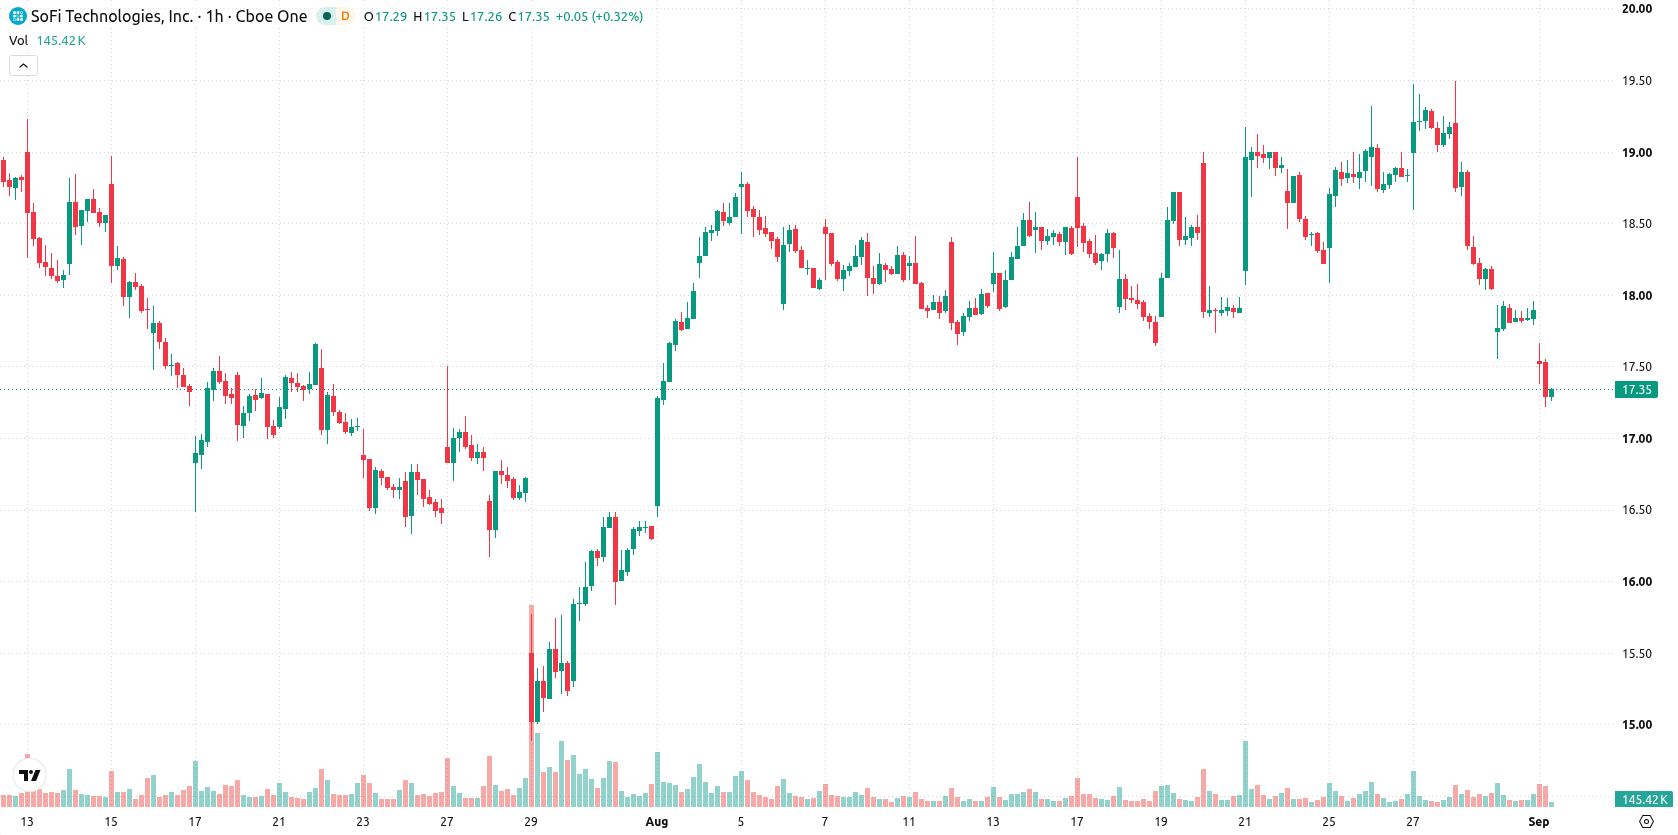
Multiple technical indicators confirm bearish bias under key resistance
On the hourly timeframe, SOFI remains below the MA-20 at $18.42 and the MA-50 at $18.63, with long-term resistance at the MA-200 set at $20.19. The Ichimoku Kijun resistance stands close at $18.52, while immediate support is defined at $16.48. MACD and ADX both show bearish momentum, supported by an RSI reading of 34.66, while CCI and Bull/Bear Power also confirm seller dominance. Stochastic RSI and the Awesome Oscillator are neutral, signaling the absence of a clear oversold or overbought condition.
Downside risk persists as support levels define near-term trajectory
Over the coming sessions, SOFI is expected to consolidate within a typical volatility band between $16.48 and $18.2. The probability of a sustained upward move is low, while a further decline remains highly likely in the near term. The baseline expectation is for sideways movement, with any bullish reversal requiring a break above the Ichimoku Kijun at $18.52, and a bearish scenario unfolding if price falls below $16.48.
Earlier, analysts noted that SoFi faced continued downward momentum despite improving fundamentals, with technical indicators highlighting unresolved directional commitment. The latest analysis reinforces this cautious outlook, with bearish momentum persisting and the key level to monitor now being a potential breakdown below $16.48, which could trigger further downside risk.










-
 Afghanistan
-
 Albania
-
 Algeria
-
 Angola
-
 Argentina
-
 Armenia
-
 Australia
-
 Austria
-
 Azerbaijan
-
 Bahamas
-
 Bahrain
-
 Bangladesh
-
 Belarus
-
 Belgium
-
 Bolivia
-
 Botswana
-
 Brazil
-
 Brunei
-
 Bulgaria
-
 Cambodia
-
 Cameroon
-
 Canada
-
 Chile
-
 China
-
 Colombia
-
 Congo
-
 Costa Rica
-
 Cote d'Ivoire
-
 Croatia
-
 Cuba
-
 Cyprus
-
 Czechia
-
 DR Congo
-
 Denmark
-
 Dominican Republic
-
 Ecuador
-
 Egypt
-
 El Salvador
-
 Estonia
-
 Eswatini
-
 Ethiopia
-
 Finland
-
 France
-
 Georgia
-
 Germany
-
 Ghana
-
 Greece
-
 Haiti
-
 Hong Kong
-
 Hungary
-
 India
-
 Indonesia
-
 Iran, Islamic republic
-
 Iraq
-
 Ireland
-
 Israel
-
 Italy
-
 Jamaica
-
 Japan
-
 Jordan
-
 Kazakhstan
-
 Kenya
-
 Korea
-
 Kuwait
-
 Kyrgyzstan
-
 Laos
-
 Latvia
-
 Lebanon
-
 Lesotho
-
 Libya
-
 Lithuania
-
 Luxembourg
-
 Madagascar
-
 Malaysia
-
 Malta
-
 Mauritius
-
 Mexico
-
 Moldova
-
 Mongolia
-
 Montenegro
-
 Morocco
-
 Mozambique
-
 Myanmar
-
 Namibia
-
 Nepal
-
 Netherlands
-
 New Zealand
-
 Nigeria
-
 North Macedonia
-
 Norway
-
 Oman
-
 Pakistan
-
 Palestine
-
 Panama
-
 Papua New Guinea
-
 Paraguay
-
 Peru
-
 Philippines
-
 Poland
-
 Portugal
-
 Puerto Rico
-
 Qatar
-
 Reunion
-
 Romania
-
 Rwanda
-
 Saudi Arabia
-
 Serbia
-
 Singapore
-
 Slovakia
-
 Slovenia
-
 Somalia
-
 South Africa
-
 Spain
-
 Sri Lanka
-
 Sweden
-
 Switzerland
-
 Syria
-
 Taiwan
-
 Tajikistan
-
 Tanzania
-
 Thailand
-
 Trinidad and Tobago
-
 Tunisia
-
 Turkey
-
 UAE
-
 Uganda
-
 Ukraine
-
 United Kingdom
-
United States
-
 Uruguay
-
 Uzbekistan
-
 Venezuela
-
 Vietnam
-
 Yemen
-
 Zambia
-
 Zimbabwe
- Forex
- Crypto












