

Can Persimmon stock hold support as sellers dominate the trend?

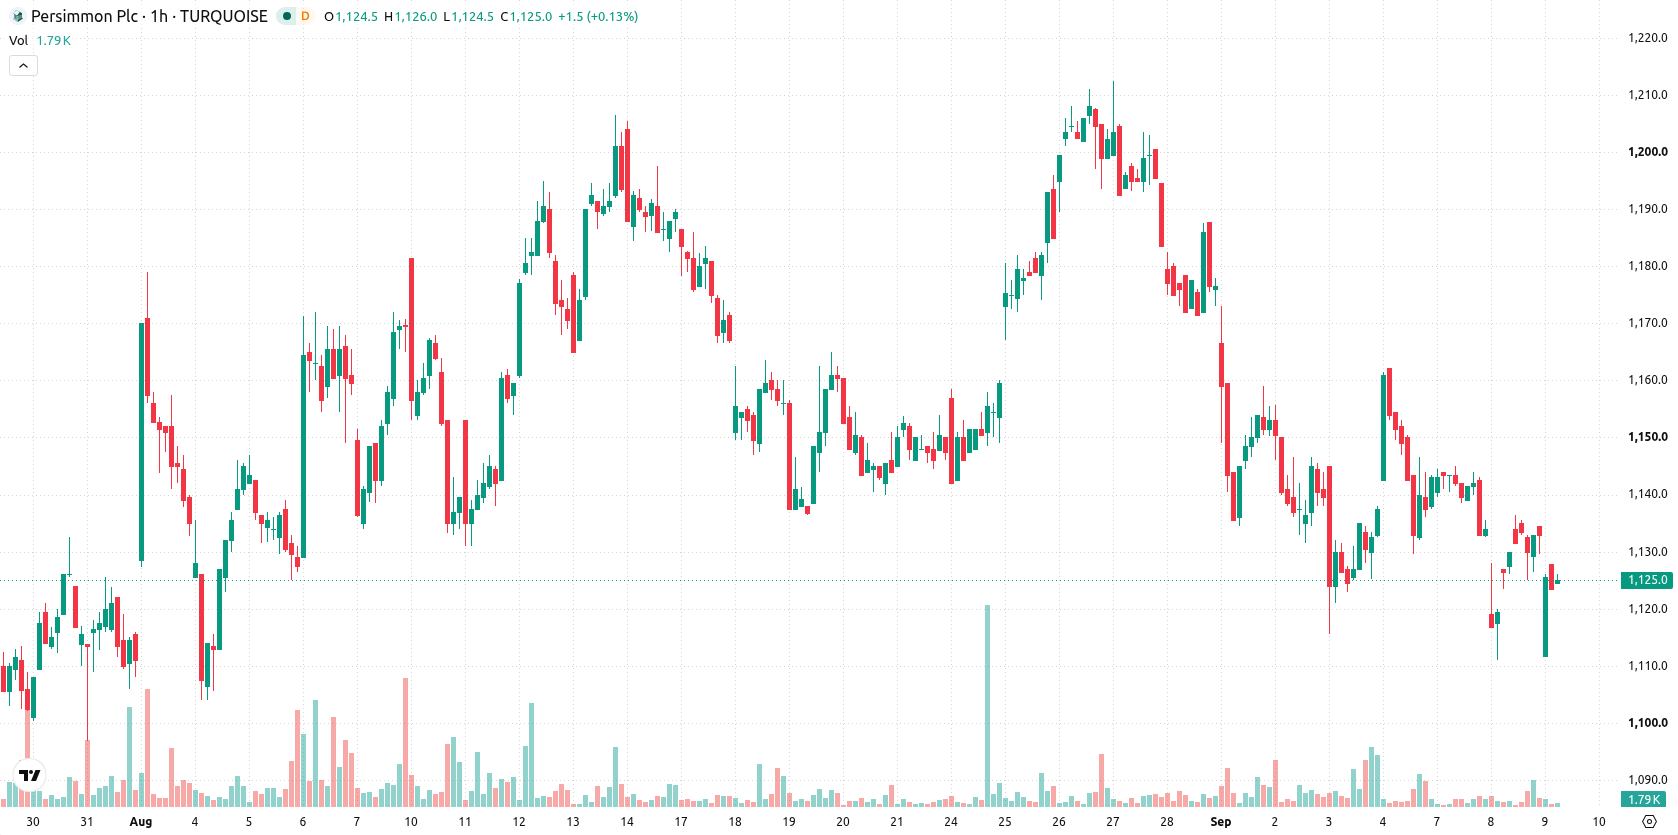
Persimmon (PSN) stock is trading at GBX1,124 after a modest decline for the session. The stock remains below its key moving averages, reflecting hesitant buying interest following recent market weakness.
 1248.00
1248.00
1248.00
Highlights
- Shares of PSN/GBX fell 0.84% to close at GBX1,124, remaining under key short-term and long-term averages.
- Short, medium, and long-term trend indicators show persistent bearish momentum, with sellers maintaining control and negative signals from most oscillators.
- Expected trading range for the next 2 to 3 days is GBX1,101 to GBX1,146, with a high probability of further decline unless resistance at GBX1,131 is breached.
Persistent selling pressure as multiple indicators confirm downtrend
On the technical side, PSN is trading below its MA-20 (GBX1,133) and MA-50 (GBX1,137) on the hourly chart, with the daily MA-200 far above at GBX1,212. The Ichimoku Kijun on the daily timeframe is at GBX1,131, creating a short-term resistance. Momentum signals are predominantly negative: both MACD and ADX point to a continuing downtrend, while RSI at 40.91 with a Sell signal and CCI also in sell territory indicate persistent selling momentum. Bull/Bear Power is in oversold territory, supporting the view of intraday seller dominance, while the Awesome Oscillator remains negative. However, the Stoch RSI has turned neutral, showing a slight divergence from the prevailing bearish momentum setup.
Downside risk dominates as PSN trades within narrow volatility band
In the short term, PSN is expected to fluctuate within the GBX1,101 to GBX1,146 volatility band relative to current levels over the next 2–3 sessions. The probability of a substantial upward move remains very low under current conditions, while a further price decline remains the primary risk scenario. Baseline expectations see the price consolidating within this corridor. If PSN decisively breaks above GBX1,131 resistance, short-term recovery attempts may develop. Conversely, a move below GBX1,101 could lead to accelerated losses as new local lows are set.
In a recent review, Persimmon shares were characterized by consolidation and a lack of clear directional movement amid prevailing technical weakness. The current analysis maintains this outlook, with sellers retaining control and a decisive break of either the GBX1,131 resistance or GBX1,101 support likely to determine PSN’s short-term trajectory.





Latest Persimmon News






-
 Afghanistan
-
 Albania
-
 Algeria
-
 Angola
-
 Argentina
-
 Armenia
-
 Australia
-
 Austria
-
 Azerbaijan
-
 Bahamas
-
 Bahrain
-
 Bangladesh
-
 Belarus
-
 Belgium
-
 Bolivia
-
 Botswana
-
 Brazil
-
 Brunei
-
 Bulgaria
-
 Cambodia
-
 Cameroon
-
 Canada
-
 Chile
Chile
-
 China
China
-
 Colombia
-
 Congo
Congo
-
 Costa Rica
-
 Cote d'Ivoire
-
 Croatia
-
 Cuba
Cuba
-
 Cyprus
-
 Czechia
-
 DR Congo
-
 Denmark
-
 Dominican Republic
-
 Ecuador
-
 Egypt
Egypt
-
 El Salvador
-
 Estonia
-
 Eswatini
-
 Ethiopia
-
 Finland
-
 France
-
 Georgia
-
 Germany
-
 Ghana
Ghana
-
 Greece
-
 Haiti
Haiti
-
 Hong Kong
-
 Hungary
-
 India
India
-
 Indonesia
-
 Iran, Islamic republic
-
 Iraq
Iraq
-
 Ireland
-
 Israel
-
 Italy
Italy
-
 Jamaica
-
 Japan
Japan
-
 Jordan
-
 Kazakhstan
-
 Kenya
Kenya
-
 Korea
Korea
-
 Kuwait
-
 Kyrgyzstan
-
 Laos
Laos
-
 Latvia
-
 Lebanon
-
 Lesotho
-
 Libya
Libya
-
 Lithuania
-
 Luxembourg
-
 Madagascar
-
 Malaysia
-
 Malta
Malta
-
 Mauritius
-
 Mexico
-
 Moldova
-
 Mongolia
-
 Montenegro
-
 Morocco
-
 Mozambique
-
 Myanmar
-
 Namibia
-
 Nepal
Nepal
-
 Netherlands
-
 New Zealand
-
 Nigeria
-
 North Macedonia
-
 Norway
-
 Oman
Oman
-
 Pakistan
-
 Palestine
-
 Panama
-
 Papua New Guinea
-
 Paraguay
-
 Peru
Peru
-
 Philippines
-
 Poland
-
 Portugal
-
 Puerto Rico
-
 Qatar
Qatar
-
 Reunion
-
 Romania
-
 Rwanda
-
 Saudi Arabia
-
 Serbia
-
 Singapore
-
 Slovakia
-
 Slovenia
-
 Somalia
-
 South Africa
-
 Spain
Spain
-
 Sri Lanka
-
 Sweden
-
 Switzerland
-
 Syria
Syria
-
 Taiwan
-
 Tajikistan
-
 Tanzania
-
 Thailand
-
 Trinidad and Tobago
-
 Tunisia
-
 Turkey
-
 UAE
UAE
-
 Uganda
-
 Ukraine
-
 United Kingdom
-
United States
-
 Uruguay
-
 Uzbekistan
-
 Venezuela
-
 Vietnam
-
 Yemen
Yemen
-
 Zambia
-
 Zimbabwe
- Forex
- Crypto












