

Target stock price prediction: Support test signals further downside risk

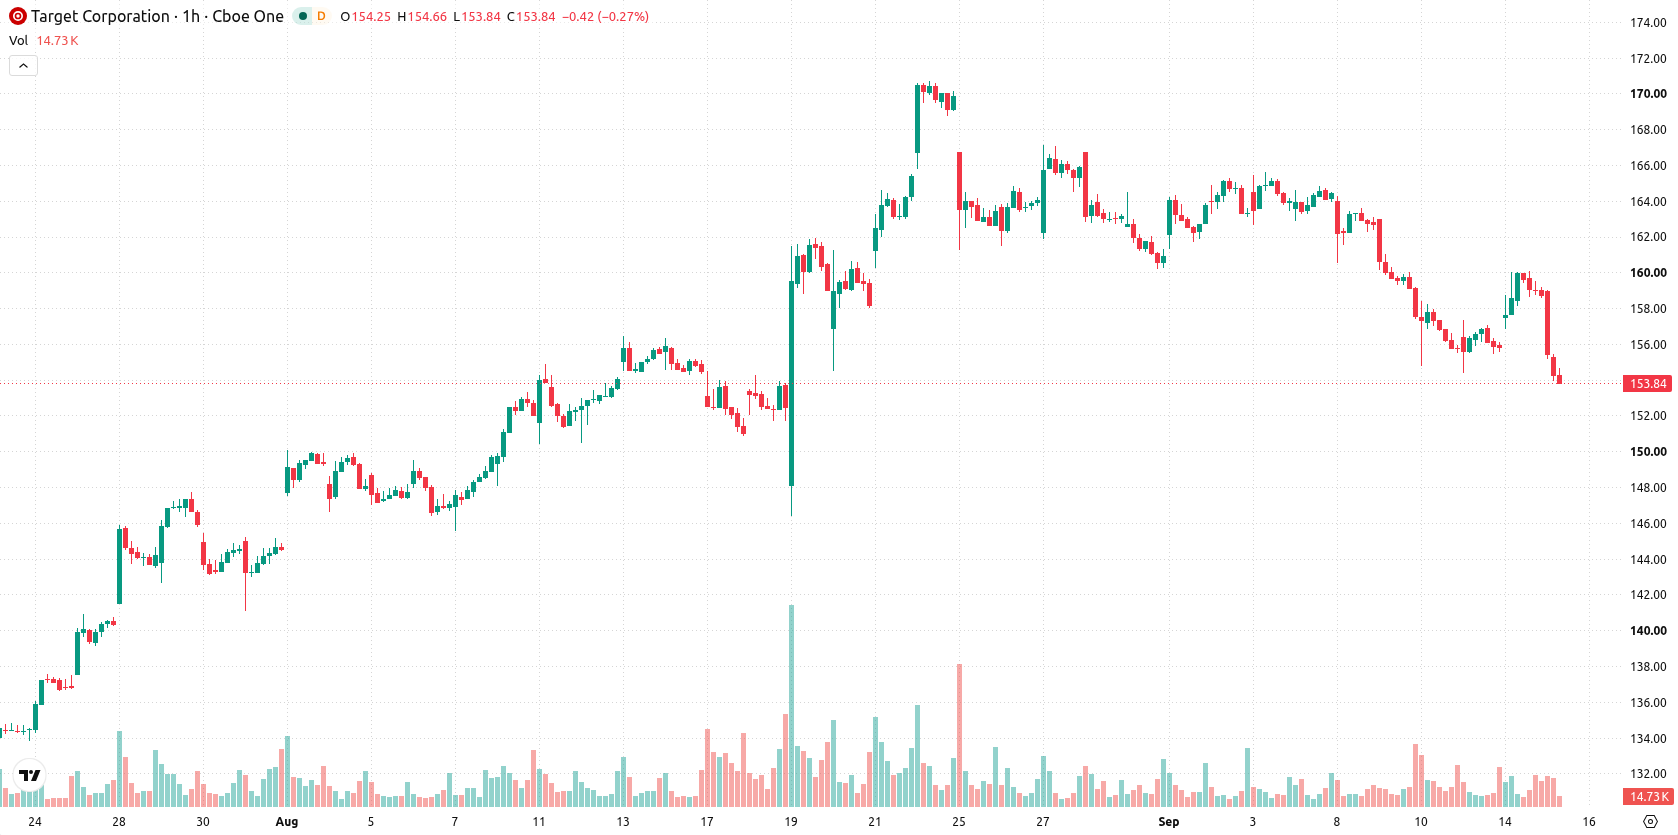
Target (TGT) stock is trading at $153.87, reflecting a decline of 3.04% on the day and closing near its session lows. The price remains below its key short- and medium-term moving averages, while still positioned above longer-term trend levels.
 159.23
Highlights
- TGT/USD trades below its short- and medium-term moving averages but remains above its long-term average, indicating mixed timeframe trends.
- Bearish momentum dominates intraday with strong selling pressure, as price falls 3.04% to $153.87 amid heightened volatility.
- Forecasted trading range is $149.84 to $157.42 for the coming days, with a 78% probability of further downside.
Persistent bearish signals as TGT tests key support levels
On the hourly chart, TGT is trading below its MA-20 and MA-50, with the long-term MA-200 offering a layer of support beneath current levels. The immediate resistance is defined by the Ichimoku Kijun at $157.23. Bearish momentum is reinforced as both MACD and ADX continue to indicate sell conditions, while RSI, Stoch RSI, CCI, and Bull/Bear Power remain in oversold territory, highlighting sustained short-term seller dominance. The Awesome Oscillator further confirms the strength of ongoing selling momentum.
Downside risk dominates as price consolidates in set range
In the short term, price action is expected to remain within the $149.84–$157.42 range under typical volatility. The probability of an upward move stands at 22%, with a 78% likelihood of further downside. Baseline expectations call for consolidation inside this corridor. Should price break above $157.23 resistance, an upward scenario could unfold, while a drop below $149.84 support would likely open the door to additional declines.
Earlier, analysts noted that Carter’s had initiated a major rebranding effort and shown operational improvement as part of its business recovery. In contrast, the current technical outlook for Target highlights pronounced short-term downside risks, making the $149.84 support level a critical area for traders to monitor in the days ahead.






Latest Target News





-
 Afghanistan
-
 Albania
-
 Algeria
-
 Angola
-
 Argentina
-
 Armenia
-
 Australia
-
 Austria
-
 Azerbaijan
-
 Bahamas
-
 Bahrain
-
 Bangladesh
-
 Belarus
-
 Belgium
-
 Bolivia
-
 Botswana
-
 Brazil
-
 Brunei
-
 Bulgaria
-
 Cambodia
-
 Cameroon
-
 Canada
-
 Chile
-
 China
-
 Colombia
-
 Congo
-
 Costa Rica
-
 Cote d'Ivoire
-
 Croatia
-
 Cuba
-
 Cyprus
-
 Czechia
-
 DR Congo
-
 Denmark
-
 Dominican Republic
-
 Ecuador
-
 Egypt
-
 El Salvador
-
 Estonia
-
 Eswatini
-
 Ethiopia
-
 Finland
-
 France
-
 Georgia
-
 Germany
-
 Ghana
-
 Greece
-
 Haiti
-
 Hong Kong
-
 Hungary
-
 India
-
 Indonesia
-
 Iran, Islamic republic
-
 Iraq
-
 Ireland
-
 Israel
-
 Italy
-
 Jamaica
-
 Japan
-
 Jordan
-
 Kazakhstan
-
 Kenya
-
 Korea
-
 Kuwait
-
 Kyrgyzstan
-
 Laos
-
 Latvia
-
 Lebanon
-
 Lesotho
-
 Libya
-
 Lithuania
-
 Luxembourg
-
 Madagascar
-
 Malaysia
-
 Malta
-
 Mauritius
-
 Mexico
-
 Moldova
-
 Mongolia
-
 Montenegro
-
 Morocco
-
 Mozambique
-
 Myanmar
-
 Namibia
-
 Nepal
-
 Netherlands
-
 New Zealand
-
 Nigeria
-
 North Macedonia
-
 Norway
-
 Oman
-
 Pakistan
-
 Palestine
-
 Panama
-
 Papua New Guinea
-
 Paraguay
-
 Peru
-
 Philippines
-
 Poland
-
 Portugal
-
 Puerto Rico
-
 Qatar
-
 Reunion
-
 Romania
-
 Rwanda
-
 Saudi Arabia
-
 Serbia
-
 Singapore
-
 Slovakia
-
 Slovenia
-
 Somalia
-
 South Africa
-
 Spain
-
 Sri Lanka
-
 Sweden
-
 Switzerland
-
 Syria
-
 Taiwan
-
 Tajikistan
-
 Tanzania
-
 Thailand
-
 Trinidad and Tobago
-
 Tunisia
-
 Turkey
-
 UAE
-
 Uganda
-
 Ukraine
-
 United Kingdom
-
United States
-
 Uruguay
-
 Uzbekistan
-
 Venezuela
-
 Vietnam
-
 Yemen
-
 Zambia
-
 Zimbabwe
- Forex
- Crypto












