

Vodafone shares drop almost 2% after payout ratio exceeds earnings in latest results

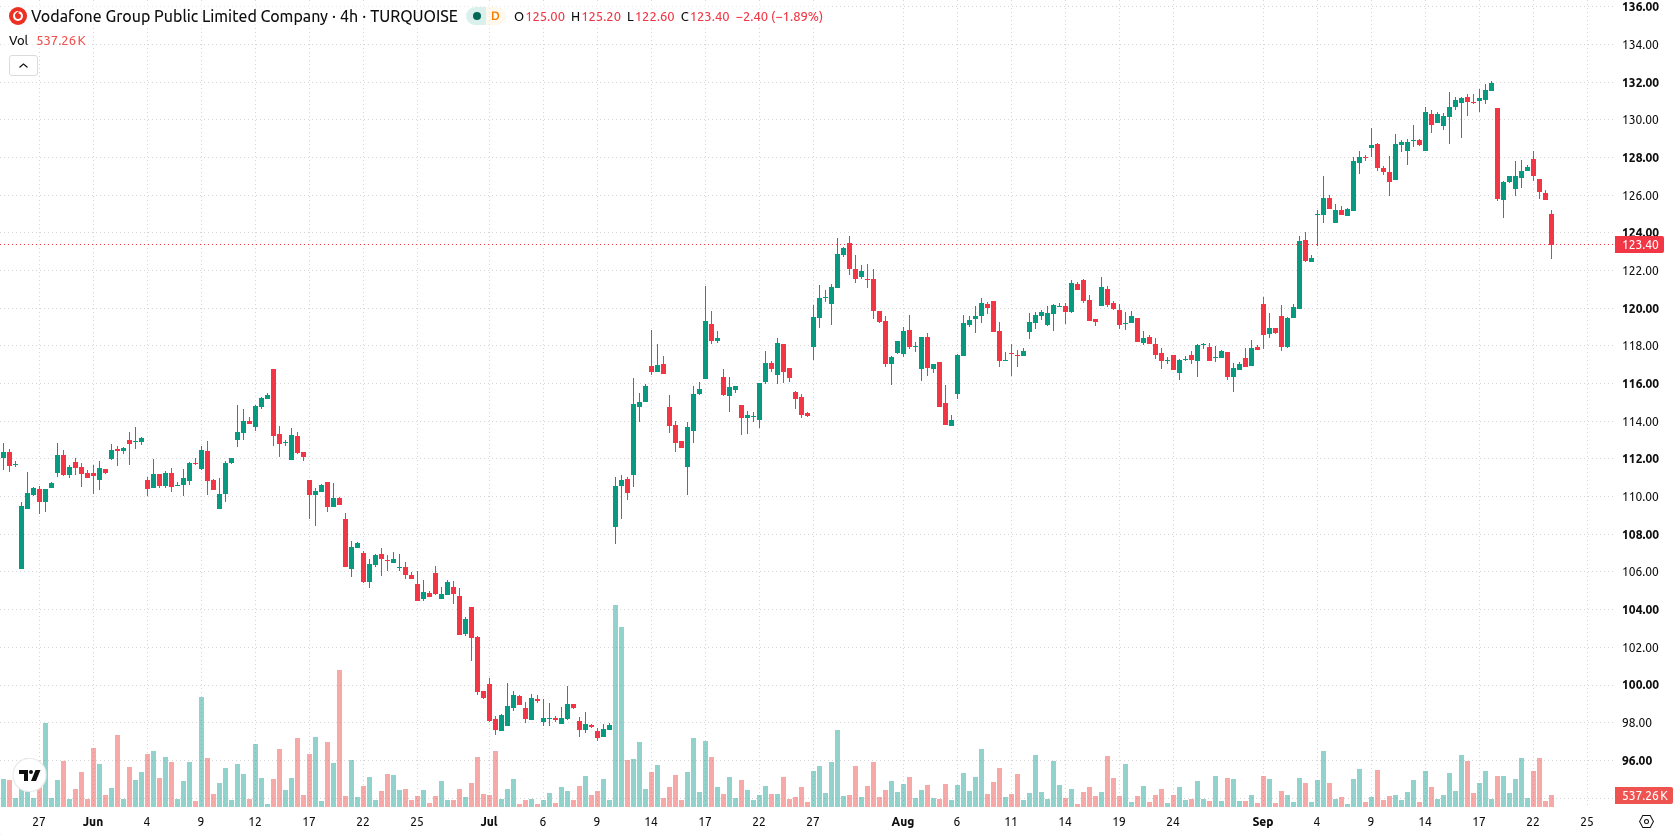
Vodafone Group Plc (VOD) retreated 1.71% as concern over a dividend payout exceeding earnings coverage weighed on sentiment. The decline is reinforced by short-term selling pressure, with the stock now trading just below its 20-day moving average and immediate resistance forming near the Ichimoku Kijun level.
 118.95
119.60
Highlights
- Vodafone reported a modest rise in operating profit for fiscal year 2026 due to cost controls and portfolio adjustments.
- Vodafone confirmed a fiscal year 2026 dividend with a 3.15% yield and a payout ratio of 101.75%, raising questions about its sustainability.
- Vodafone stock faces short-term selling pressure near resistance, with a projected five-day range of GBX119.97 to GBX127.33 and sideways consolidation likely.
Dividend sustainability fears offset profit rise amid executive share sale
Vodafone reported its fiscal year 2026 results, showing a slight increase in operating profit attributed to cost-efficiency measures and portfolio streamlining. The company confirmed a dividend for fiscal year 2026 with a yield of around 3.15%, though the payout ratio reached roughly 101.75%, raising questions about dividend sustainability. Free cash flow was reported above £5.1 billion, supporting ongoing dividends. An executive sale of 500,000 shares by Joakim Reiter was disclosed, accompanied by stable liquidity and trading volumes, though price action has remained under broader selling pressure.
Mixed momentum signals emerge as price tests resistance and supports
Vodafone is currently positioned just below its 20-day moving average (GBX124.96), while staying above the 50-day (GBX120.76) and 200-day (GBX111.58) levels. This configuration indicates short-term downside pressure from sellers but retains a constructive medium- and long-term trend. Immediate resistance is seen at the Ichimoku Kijun line (GBX123.85), and the closest support lies at the MA-50 (GBX120.76). Momentum remains mixed: the MACD gives a “Strong Buy” signal, while the ADX is neutral. The RSI stands at 53.94, in buy territory. However, the Stochastic RSI is at zero, suggesting oversold conditions, and the CCI is neutral. Bull/Bear Power at 0.95 indicates buyers dominated intraday, forecasting overbought risk, yet recent sentiment shows selling pressure after an early upside gap.
Earlier, analysts noted that Vodafone maintained a bullish technical structure despite some concerns over dividend sustainability and mixed momentum signals. The current analysis adds a new dimension by emphasizing short-term selling pressure below key moving averages, highlighting GBX120.76 as an important level to watch for downside risk in the days ahead.









-
 Afghanistan
-
 Albania
-
 Algeria
-
 Angola
-
 Argentina
-
 Armenia
-
 Australia
-
 Austria
-
 Azerbaijan
-
 Bahamas
-
 Bahrain
-
 Bangladesh
-
 Belarus
-
 Belgium
-
 Bolivia
-
 Botswana
-
 Brazil
-
 Brunei
-
 Bulgaria
-
 Cambodia
-
 Cameroon
-
 Canada
-
 Chile
-
 China
-
 Colombia
-
 Congo
-
 Costa Rica
-
 Cote d'Ivoire
-
 Croatia
-
 Cuba
-
 Cyprus
-
 Czechia
-
 DR Congo
-
 Denmark
-
 Dominican Republic
-
 Ecuador
-
 Egypt
-
 El Salvador
-
 Estonia
-
 Eswatini
-
 Ethiopia
-
 Finland
-
 France
-
 Georgia
-
 Germany
-
 Ghana
-
 Greece
-
 Haiti
-
 Hong Kong
-
 Hungary
-
 India
-
 Indonesia
-
 Iran, Islamic republic
-
 Iraq
-
 Ireland
-
 Israel
-
 Italy
-
 Jamaica
-
 Japan
-
 Jordan
-
 Kazakhstan
-
 Kenya
-
 Korea
-
 Kuwait
-
 Kyrgyzstan
-
 Laos
-
 Latvia
-
 Lebanon
-
 Lesotho
-
 Libya
-
 Lithuania
-
 Luxembourg
-
 Madagascar
-
 Malaysia
-
 Malta
-
 Mauritius
-
 Mexico
-
 Moldova
-
 Mongolia
-
 Montenegro
-
 Morocco
-
 Mozambique
-
 Myanmar
-
 Namibia
-
 Nepal
-
 Netherlands
-
 New Zealand
-
 Nigeria
-
 North Macedonia
-
 Norway
-
 Oman
-
 Pakistan
-
 Palestine
-
 Panama
-
 Papua New Guinea
-
 Paraguay
-
 Peru
-
 Philippines
-
 Poland
-
 Portugal
-
 Puerto Rico
-
 Qatar
-
 Reunion
-
 Romania
-
 Rwanda
-
 Saudi Arabia
-
 Serbia
-
 Singapore
-
 Slovakia
-
 Slovenia
-
 Somalia
-
 South Africa
-
 Spain
-
 Sri Lanka
-
 Sweden
-
 Switzerland
-
 Syria
-
 Taiwan
-
 Tajikistan
-
 Tanzania
-
 Thailand
-
 Trinidad and Tobago
-
 Tunisia
-
 Turkey
-
 UAE
-
 Uganda
-
 Ukraine
-
 United Kingdom
-
United States
-
 Uruguay
-
 Uzbekistan
-
 Venezuela
-
 Vietnam
-
 Yemen
-
 Zambia
-
 Zimbabwe
- Forex
- Crypto












