

Broadcom shares weekly forecast: Stalls below resistance with volatility elevated and RSI neutral

Shares of Broadcom Inc. (AVGO) are trading near $348 after falling around 3% over the past week, as the stock struggles to hold support amid renewed pressure. Corporate actions and regulatory scrutiny remain key factors to watch as the new week begins.
 341.00
352.77
Highlights
- Shares of Broadcom fell 2.7% over the past week and now trade below all major moving averages.
- Price action is near the bottom of the recent weekly range with strong sell momentum indicated by technical signals.
- Shares are projected to trade between $342.24 and $359.7 in the next five days, with a high probability of further decline unless price moves decisively above $353.59.
AI revenue surge and China review shape sentiment through major capital moves
Broadcom reported third-quarter fiscal 2026 revenue of $29.6 billion, up 85.5% year-over-year, with AI semiconductor revenue surging 221%, according to Seeking Alpha and Yahoo Finance. The company also wrapped up a $10.93 billion share repurchase program and launched a fixed-income exchange offer for $654 million of its notes due 2037, as noted by Yahoo Finance. Additionally, CNBC and Investing.com highlighted that Chinese authorities are reviewing the company's hardware in state-backed data centers, a move that could impact AVGO's exposure in the region ahead.
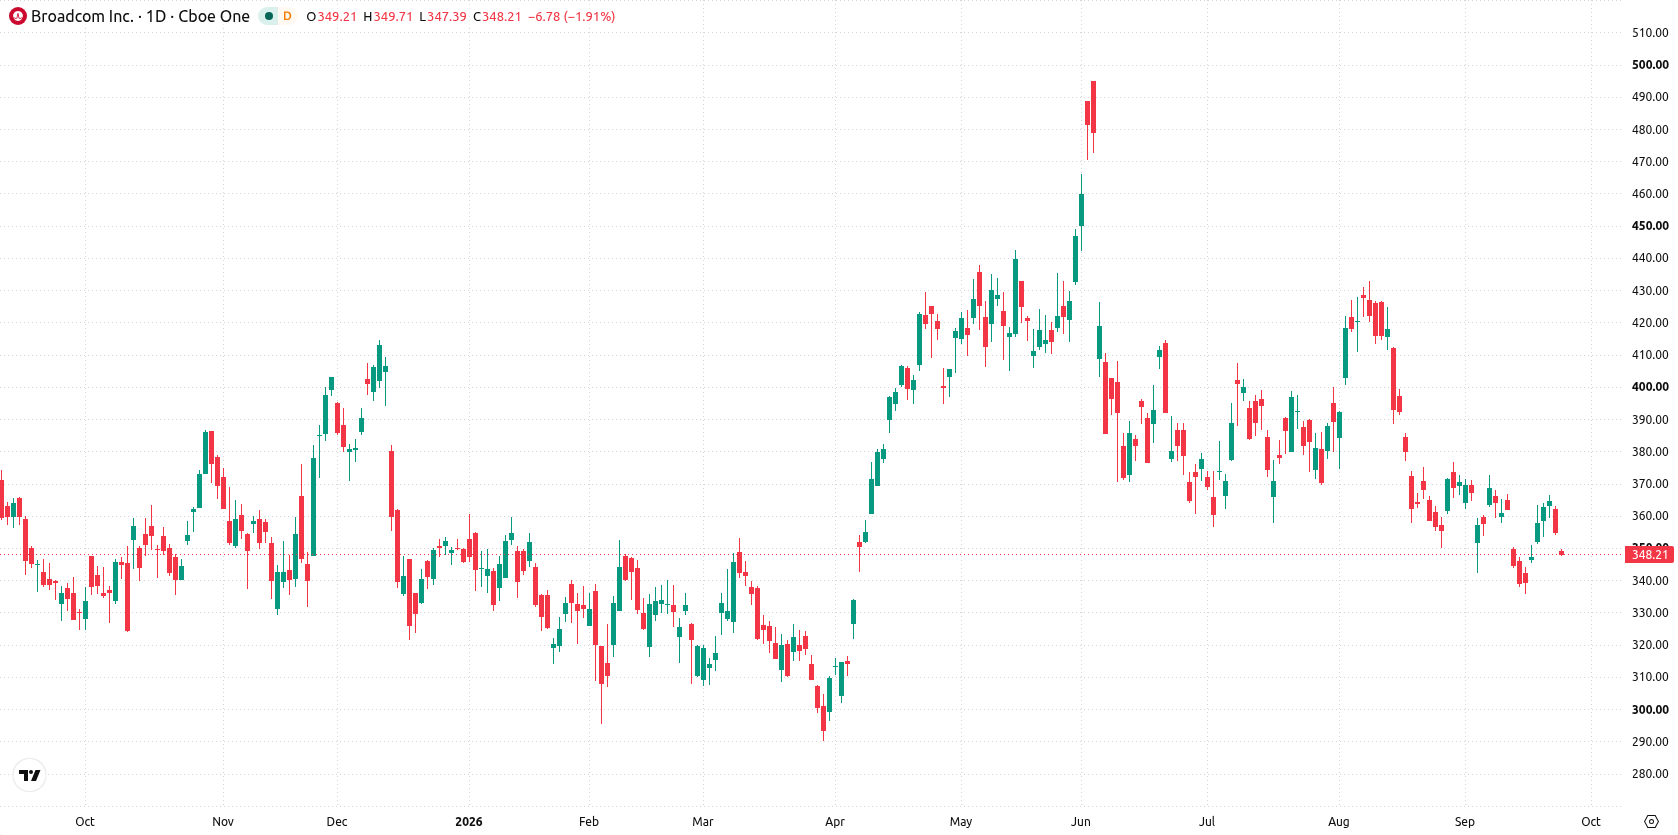
Sell momentum prevails this week as MACD and HMA confirm downside risk
On the daily chart, the setup shows a developing but unconfirmed move lower with volatility at 3.67%. MACD stands at -7.32 and signals strong sell momentum, aligning with a negative signal from the HMA, while RSI at 44.4 remains in a neutral zone. The nearest resistance is at $353.59 and the Ichimoku Kijun at $360.84 offers further overhead supply, with no nearby support evident, which leaves the stock vulnerable to further downside if selling persists.
Downside bias in the coming week as resistance caps range and bearish risk builds
Over the next five trading days, Broadcom shares are expected to trade between $342.24 and $359.7. There is a very low probability of an increase and a very high probability of a decrease during this period. The base case sees price remaining capped below $353.59 resistance. A bullish scenario would require a decisive move above $353.59 to signal upside potential. Conversely, a drop through $342.24 would indicate accelerated bearish momentum and open the way for deeper declines.
Earlier, analysts noted that despite strong fundamental growth in Broadcom’s AI semiconductor segment and significant capital returns, the stock remained under pressure due to persistent bearish technical momentum. The latest price action and regulatory scrutiny reinforce downside risks, with traders closely monitoring whether Broadcom can hold above $342.24 to avoid a deeper decline in the near term.





Latest Broadcom News



-
 Afghanistan
-
 Albania
-
 Algeria
-
 Angola
-
 Argentina
-
 Armenia
-
 Australia
-
 Austria
-
 Azerbaijan
-
 Bahamas
-
 Bahrain
-
 Bangladesh
-
 Belarus
-
 Belgium
-
 Bolivia
-
 Botswana
-
 Brazil
-
 Brunei
-
 Bulgaria
-
 Cambodia
-
 Cameroon
-
 Canada
-
 Chile
-
 China
-
 Colombia
-
 Congo
-
 Costa Rica
-
 Cote d'Ivoire
-
 Croatia
-
 Cuba
-
 Cyprus
-
 Czechia
-
 DR Congo
-
 Denmark
-
 Dominican Republic
-
 Ecuador
-
 Egypt
-
 El Salvador
-
 Estonia
-
 Eswatini
-
 Ethiopia
-
 Finland
-
 France
-
 Georgia
-
 Germany
-
 Ghana
-
 Greece
-
 Haiti
-
 Hong Kong
-
 Hungary
-
 India
-
 Indonesia
-
 Iran, Islamic republic
-
 Iraq
-
 Ireland
-
 Israel
-
 Italy
-
 Jamaica
-
 Japan
-
 Jordan
-
 Kazakhstan
-
 Kenya
-
 Korea
-
 Kuwait
-
 Kyrgyzstan
-
 Laos
-
 Latvia
-
 Lebanon
-
 Lesotho
-
 Libya
-
 Lithuania
-
 Luxembourg
-
 Madagascar
-
 Malaysia
-
 Malta
-
 Mauritius
-
 Mexico
-
 Moldova
-
 Mongolia
-
 Montenegro
-
 Morocco
-
 Mozambique
-
 Myanmar
-
 Namibia
-
 Nepal
-
 Netherlands
-
 New Zealand
-
 Nigeria
-
 North Macedonia
-
 Norway
-
 Oman
-
 Pakistan
-
 Palestine
-
 Panama
-
 Papua New Guinea
-
 Paraguay
-
 Peru
-
 Philippines
-
 Poland
-
 Portugal
-
 Puerto Rico
-
 Qatar
-
 Reunion
-
 Romania
-
 Rwanda
-
 Saudi Arabia
-
 Serbia
-
 Singapore
-
 Slovakia
-
 Slovenia
-
 Somalia
-
 South Africa
-
 Spain
-
 Sri Lanka
-
 Sweden
-
 Switzerland
-
 Syria
-
 Taiwan
-
 Tajikistan
-
 Tanzania
-
 Thailand
-
 Trinidad and Tobago
-
 Tunisia
-
 Turkey
-
 UAE
-
 Uganda
-
 Ukraine
-
 United Kingdom
-
United States
-
 Uruguay
-
 Uzbekistan
-
 Venezuela
-
 Vietnam
-
 Yemen
-
 Zambia
-
 Zimbabwe
- Forex
- Crypto












