

Aviva stock holds near GBX703.3 resistance as seller pressure outweighs short-term buyers

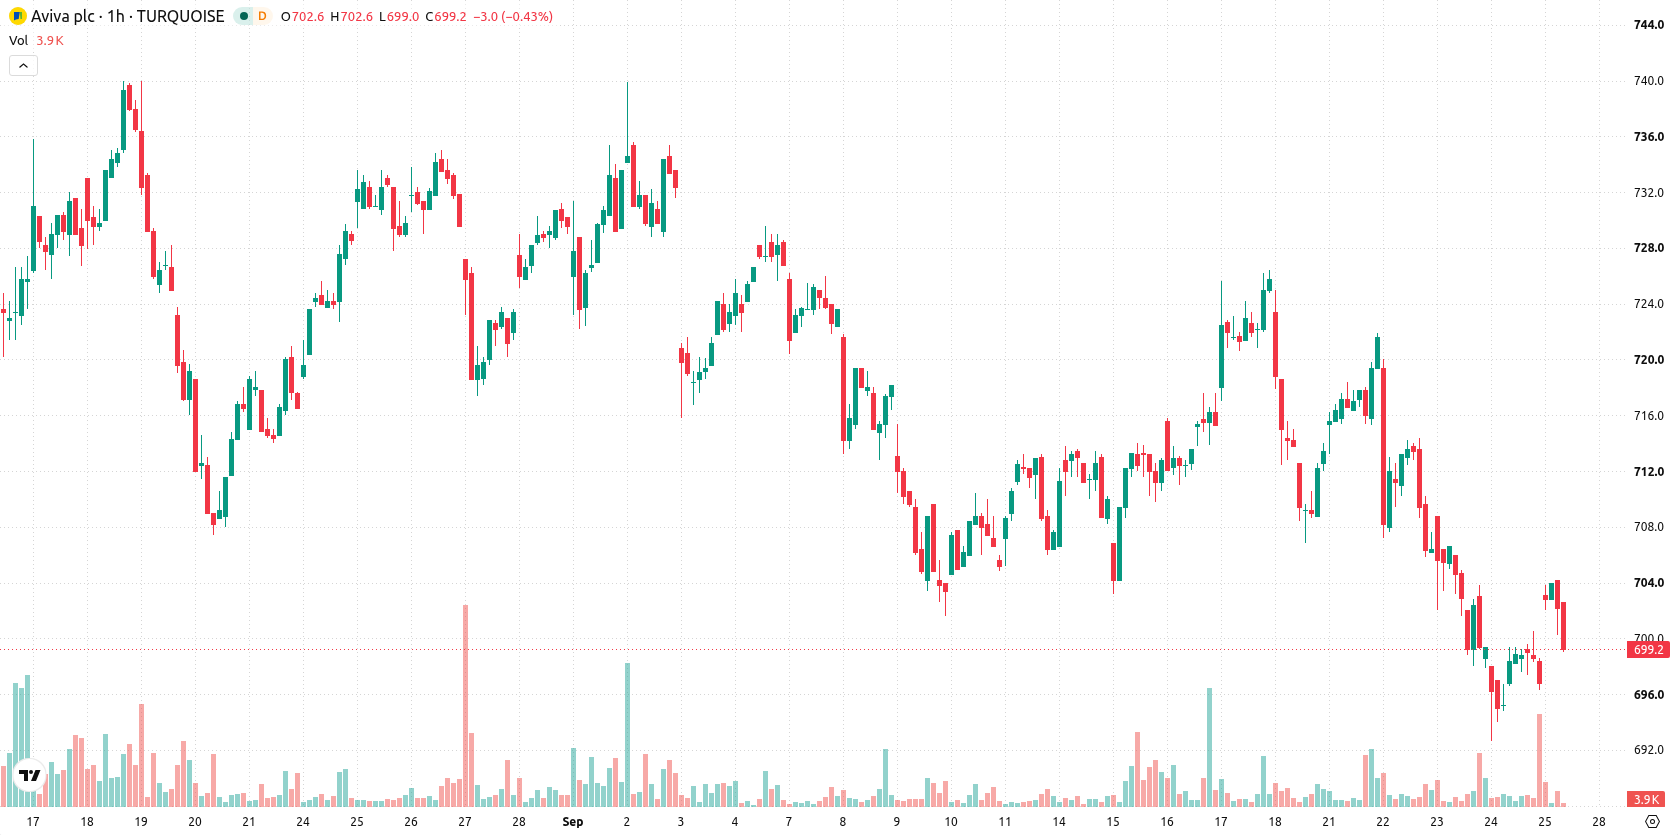
Aviva (AV) stock is trading at GBX699.8 after a modest rise on the day. Its price remains below its main short- and medium-term moving averages, while holding above longer-term averages.
 696.00
688.20
696.00
688.20
Highlights
- AV/GBX stock trades below key short- and medium-term moving averages, indicating ongoing selling pressure.
- Broader momentum indicators such as MACD and ADX issue sell signals, with a weak RSI reinforcing the negative trend.
- Price is expected to trade between GBX686.56 and GBX713.04 in the near term, with a high likelihood of a move lower.
Mixed momentum and resistance at Kijun cap bullish conviction
MA-20 at GBX700.24 and MA-50 at GBX708.11 remain above the last traded price, with MA-200 providing support lower at GBX658.23. Immediate resistance is marked by the Ichimoku Kijun at GBX703.3. MACD and ADX signal selling momentum, while RSI sits at 47.08, also indicating a sell. Stochastic RSI and CCI both present mixed readings. Bull/Bear Power reflects buyer strength intraday, but this is contradicted by broader momentum indicators, highlighting uncertainty in the current setup.
Sideways bias likely as volatility stays muted, downside risk grows
AV is set to trade within a range of GBX686.56 to GBX713.04 in the near term. The most probable scenario is continued sideways movement inside this band, given conflicting signals and low volatility. The likelihood of a move higher is currently very low, while the chance of a downward break is rated high. Upside action would require a decisive move above GBX703.3, while downside risk increases on a fall below GBX686.56.
Earlier, analysts noted that India’s planned insurance commission caps are reshaping business models across the country’s insurance sector, with implications for distributors and competitive dynamics. While that regulatory backdrop affects the wider landscape, Aviva’s current technical setup signals an elevated risk of a downside break near GBX686.56, which traders should monitor closely as a potential trigger for increased volatility.











-
 Afghanistan
-
 Albania
-
 Algeria
-
 Angola
-
 Argentina
-
 Armenia
-
 Australia
-
 Austria
-
 Azerbaijan
-
 Bahamas
-
 Bahrain
-
 Bangladesh
-
 Belarus
-
 Belgium
-
 Bolivia
-
 Botswana
-
 Brazil
-
 Brunei
-
 Bulgaria
-
 Cambodia
-
 Cameroon
-
 Canada
-
 Chile
Chile
-
 China
China
-
 Colombia
-
 Congo
Congo
-
 Costa Rica
-
 Cote d'Ivoire
-
 Croatia
-
 Cuba
Cuba
-
 Cyprus
-
 Czechia
-
 DR Congo
-
 Denmark
-
 Dominican Republic
-
 Ecuador
-
 Egypt
Egypt
-
 El Salvador
-
 Estonia
-
 Eswatini
-
 Ethiopia
-
 Finland
-
 France
-
 Georgia
-
 Germany
-
 Ghana
Ghana
-
 Greece
-
 Haiti
Haiti
-
 Hong Kong
-
 Hungary
-
 India
India
-
 Indonesia
-
 Iran, Islamic republic
-
 Iraq
Iraq
-
 Ireland
-
 Israel
-
 Italy
Italy
-
 Jamaica
-
 Japan
Japan
-
 Jordan
-
 Kazakhstan
-
 Kenya
Kenya
-
 Korea
Korea
-
 Kuwait
-
 Kyrgyzstan
-
 Laos
Laos
-
 Latvia
-
 Lebanon
-
 Lesotho
-
 Libya
Libya
-
 Lithuania
-
 Luxembourg
-
 Madagascar
-
 Malaysia
-
 Malta
Malta
-
 Mauritius
-
 Mexico
-
 Moldova
-
 Mongolia
-
 Montenegro
-
 Morocco
-
 Mozambique
-
 Myanmar
-
 Namibia
-
 Nepal
Nepal
-
 Netherlands
-
 New Zealand
-
 Nigeria
-
 North Macedonia
-
 Norway
-
 Oman
Oman
-
 Pakistan
-
 Palestine
-
 Panama
-
 Papua New Guinea
-
 Paraguay
-
 Peru
Peru
-
 Philippines
-
 Poland
-
 Portugal
-
 Puerto Rico
-
 Qatar
Qatar
-
 Reunion
-
 Romania
-
 Rwanda
-
 Saudi Arabia
-
 Serbia
-
 Singapore
-
 Slovakia
-
 Slovenia
-
 Somalia
-
 South Africa
-
 Spain
Spain
-
 Sri Lanka
-
 Sweden
-
 Switzerland
-
 Syria
Syria
-
 Taiwan
-
 Tajikistan
-
 Tanzania
-
 Thailand
-
 Trinidad and Tobago
-
 Tunisia
-
 Turkey
-
 UAE
UAE
-
 Uganda
-
 Ukraine
-
 United Kingdom
-
United States
-
 Uruguay
-
 Uzbekistan
-
 Venezuela
-
 Vietnam
-
 Yemen
Yemen
-
 Zambia
-
 Zimbabwe
- Forex
- Crypto












