

Aviva shares technical analysis: Upward trend supported by buyer strength and overbought signals

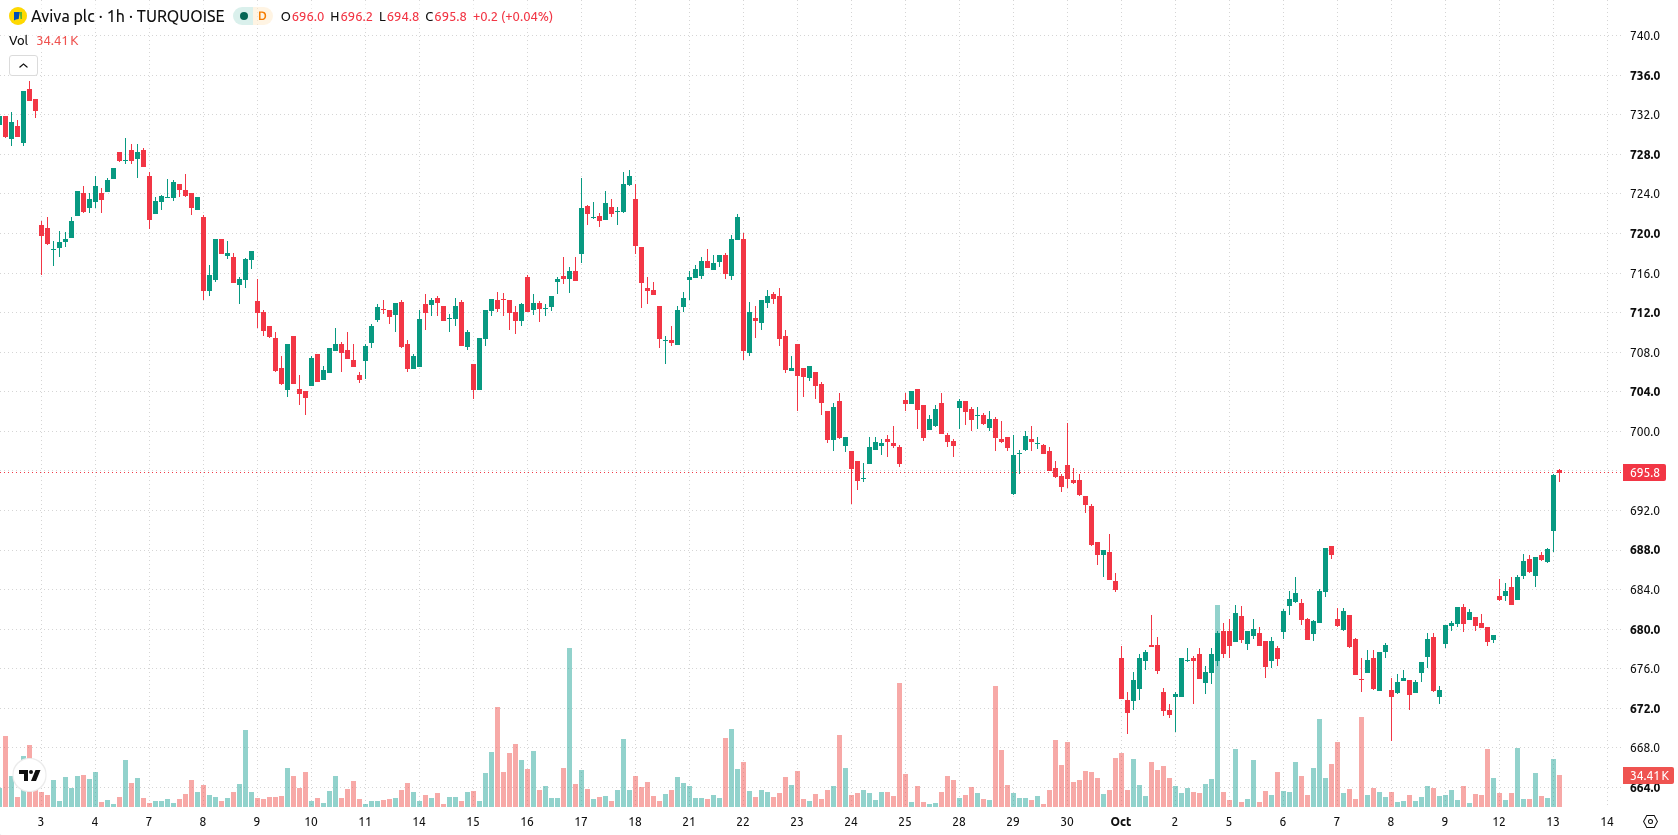
Aviva (AV) stock is trading at GBX696, up 1.25% on the day and positioned above its key moving averages, reflecting robust intraday momentum.
 698.40
698.40
698.40
Highlights
- Aviva plans to launch an AI-driven claims agent and reported a new record of £233 million in suspect claims for 2025.
- Recent director share purchases indicate insider activity that may support future demand for Aviva stock.
- Shares of Aviva trade near GBX696, above key support, with technical signals indicating strong bullish momentum but overbought conditions; forecast range is GBX687.23 to GBX704.77.
AI-driven claims and insider buying as dual pillars for optimism
Aviva's near-term launch of its AI-enabled claims agent, coupled with the company reporting a record £233 million in suspect claims for 2025, underscores its active adoption of artificial intelligence to advance fraud detection and operational risk management, according to Financexmagazine. This concrete progress in technology integration positions Aviva to benefit from improved cost controls and efficiency, which can support stronger future earnings and investor interest. Additionally, recent director share purchases, as noted by Kalkinemedia, signal insider confidence that may further bolster demand for the stock.
Momentum stretch flagged as overbought signals counter trend strength
On the technical side, AV is trading above the MA-20 at GBX684.32 and the MA-50 at GBX680.83 on the hourly chart, as well as well above the MA-200 at GBX659.29 on the daily chart. The Ichimoku Kijun level at GBX683.8 marks immediate support. MACD is on Buy, while ADX reads Neutral. Momentum signals show strength, with RSI elevated at 73.18 (Buy), and Stoch RSI, CCI, and Bull/Bear Power all signaling overbought conditions. The Awesome Oscillator supports the upward trend, but overextension on multiple oscillators suggests the market could be temporarily stretched.
Sideways move favored as breakout hinges on key technical levels
In the short term, AV is expected to trade within a range of GBX687.23 to GBX704.77, capturing typical volatility around current levels. There is a 73% probability of an upward move, with the baseline scenario favoring sideways action in this corridor. A bullish breakout would require a sustained move above the upper end of the forecast range, while a bearish scenario would be triggered by a break below immediate support at GBX683.8, potentially opening the way toward the lower boundary of the projected range.
Earlier, analysts noted that sector-wide constraints and cost pressures restricted insurers' ability to raise premiums, despite ongoing operational challenges. The current setup for Aviva adds a new dimension with technology-driven fraud control supporting near-term resilience, and traders should watch for a decisive move above GBX704.77 to signal further upside momentum.










-
 Afghanistan
-
 Albania
-
 Algeria
-
 Angola
-
 Argentina
-
 Armenia
-
 Australia
-
 Austria
-
 Azerbaijan
-
 Bahamas
-
 Bahrain
-
 Bangladesh
-
 Belarus
-
 Belgium
-
 Bolivia
-
 Botswana
-
 Brazil
-
 Brunei
-
 Bulgaria
-
 Cambodia
-
 Cameroon
-
 Canada
-
 Chile
Chile
-
 China
China
-
 Colombia
-
 Congo
Congo
-
 Costa Rica
-
 Cote d'Ivoire
-
 Croatia
-
 Cuba
Cuba
-
 Cyprus
-
 Czechia
-
 DR Congo
-
 Denmark
-
 Dominican Republic
-
 Ecuador
-
 Egypt
Egypt
-
 El Salvador
-
 Estonia
-
 Eswatini
-
 Ethiopia
-
 Finland
-
 France
-
 Georgia
-
 Germany
-
 Ghana
Ghana
-
 Greece
-
 Haiti
Haiti
-
 Hong Kong
-
 Hungary
-
 India
India
-
 Indonesia
-
 Iran, Islamic republic
-
 Iraq
Iraq
-
 Ireland
-
 Israel
-
 Italy
Italy
-
 Jamaica
-
 Japan
Japan
-
 Jordan
-
 Kazakhstan
-
 Kenya
Kenya
-
 Korea
Korea
-
 Kuwait
-
 Kyrgyzstan
-
 Laos
Laos
-
 Latvia
-
 Lebanon
-
 Lesotho
-
 Libya
Libya
-
 Lithuania
-
 Luxembourg
-
 Madagascar
-
 Malaysia
-
 Malta
Malta
-
 Mauritius
-
 Mexico
-
 Moldova
-
 Mongolia
-
 Montenegro
-
 Morocco
-
 Mozambique
-
 Myanmar
-
 Namibia
-
 Nepal
Nepal
-
 Netherlands
-
 New Zealand
-
 Nigeria
-
 North Macedonia
-
 Norway
-
 Oman
Oman
-
 Pakistan
-
 Palestine
-
 Panama
-
 Papua New Guinea
-
 Paraguay
-
 Peru
Peru
-
 Philippines
-
 Poland
-
 Portugal
-
 Puerto Rico
-
 Qatar
Qatar
-
 Reunion
-
 Romania
-
 Rwanda
-
 Saudi Arabia
-
 Serbia
-
 Singapore
-
 Slovakia
-
 Slovenia
-
 Somalia
-
 South Africa
-
 Spain
Spain
-
 Sri Lanka
-
 Sweden
-
 Switzerland
-
 Syria
Syria
-
 Taiwan
-
 Tajikistan
-
 Tanzania
-
 Thailand
-
 Trinidad and Tobago
-
 Tunisia
-
 Turkey
-
 UAE
UAE
-
 Uganda
-
 Ukraine
-
 United Kingdom
-
United States
-
 Uruguay
-
 Uzbekistan
-
 Venezuela
-
 Vietnam
-
 Yemen
Yemen
-
 Zambia
-
 Zimbabwe
- Forex
- Crypto












