

Dividend cut frees C$2.7 billion cash: Can TELUS stock hold C$11.79 support?

TELUS (T) stock is trading at C$12.01, with a narrow decline on the day. The price sits below its key moving averages, reflecting recent downside pressure in the short and medium term.
 12.63
12.65
Highlights
- TELUS cut its dividend by 55%, aiming to realize C$2.7 billion in cash savings through 2028 for debt reduction.
- TELUS halted all acquisitions and is reviewing non-core assets, focusing strategy on core telecom and AI infrastructure.
- TELUS stock trades below key moving averages with negative momentum, likely to trade between C$11.79 and C$12.23 near term.
Dividend cut and asset review as management prioritizes deleveraging
TELUS implemented a 55% dividend cut, a move which substantially reduced shareholder payouts and freed up internal capital, according to Kalkine. This action is expected to generate about C$2.7 billion in cumulative cash savings through 2028, providing additional funds to reduce debt and reinforcing management's focus on deleveraging. The company has also paused all mergers and acquisitions, while reviewing non-core assets such as TELUS Digital and TELUS Health, signaling a tactical shift toward its core telecommunications and AI infrastructure, as stated by Finance Yahoo. These developments mark a significant strategic retrenchment, though price action has remained under broader selling pressure.
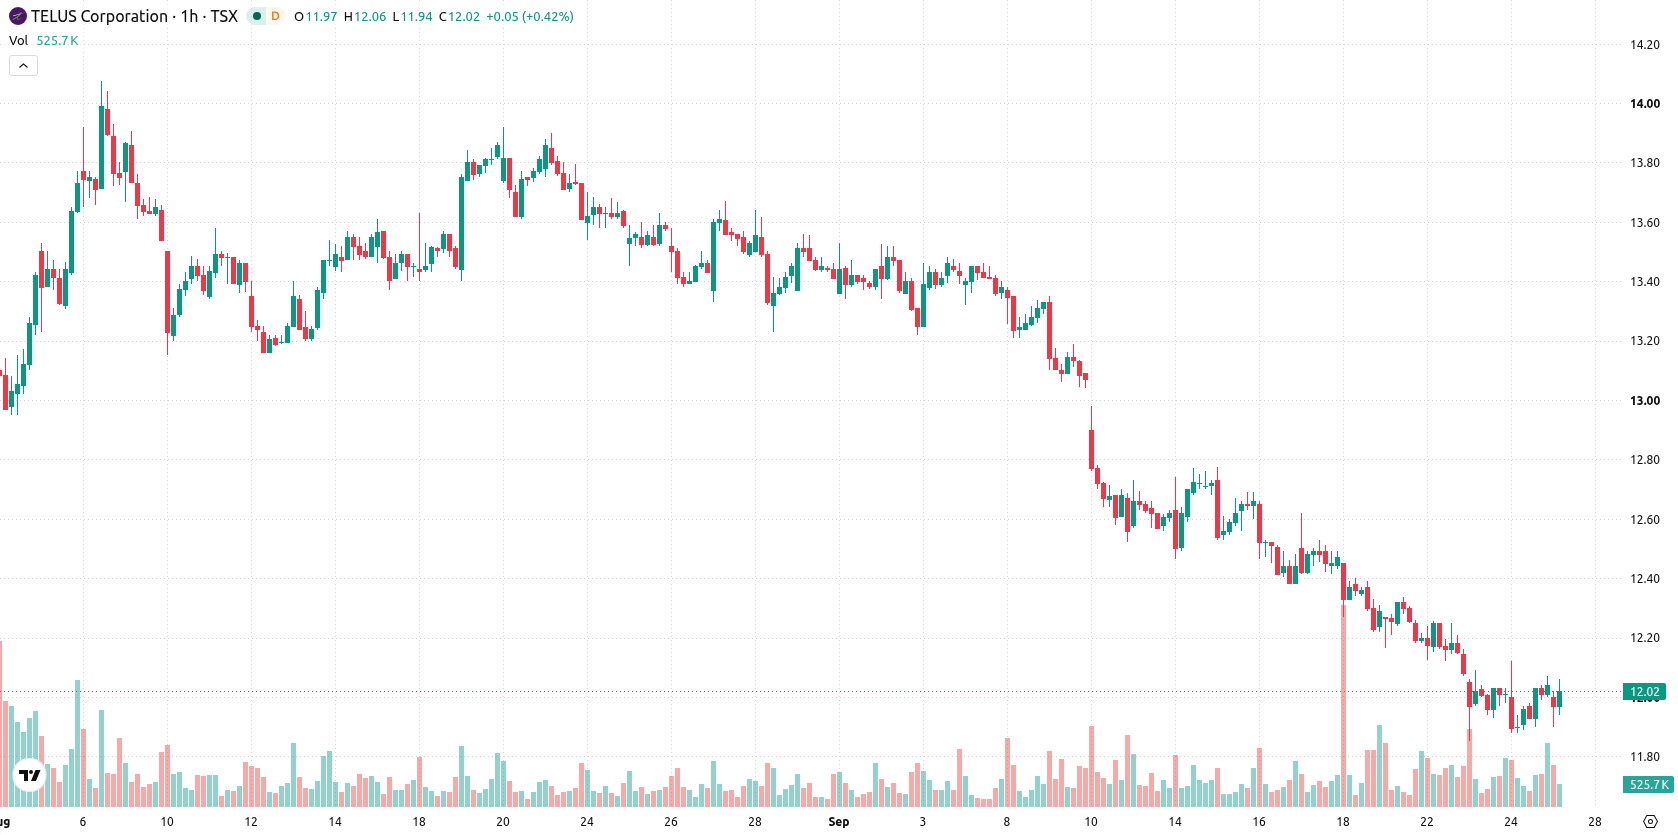
Bearish momentum persists as resistance and mixed signals emerge
On the technical front, T is trading below the MA-20, MA-50, and the long-term MA-200 (C$16.54) on the H1 timeframe. The Ichimoku Kijun at C$12.10 serves as immediate resistance. Momentum indicators are generally negative: MACD and ADX both register active sell signals, while RSI reads 44.64 and also points to a sell bias. Stoch RSI signals overbought conditions, and CCI is neutral, highlighting divergence among oscillators. Bull/Bear Power is classified as Strong Buy, suggesting buyer activity intraday despite otherwise bearish momentum, while the Awesome Oscillator remains neutral.
Downward risk outweighs rebound amid consolidation range
In the short term, T is expected to consolidate within a typical volatility band of C$11.79 to C$12.23. The probability of an upward move stands at 35%, while a downward move is more likely at 65%. If price breaks above the C$12.10 Kijun resistance, further gains could follow; conversely, a close below C$11.79 would expose the stock to additional downside risk.
Earlier, analysts noted that TELUS stock was experiencing sustained downside momentum and negative technical signals, reflecting a cautious outlook. The current analysis reinforces this prevailing scenario, and traders should closely monitor the C$12.10 resistance level for potential confirmation of any near-term directional shift.










-
 Afghanistan
-
 Albania
-
 Algeria
-
 Angola
-
 Argentina
-
 Armenia
-
 Australia
-
 Austria
-
 Azerbaijan
-
 Bahamas
-
 Bahrain
-
 Bangladesh
-
 Belarus
-
 Belgium
-
 Bolivia
-
 Botswana
-
 Brazil
-
 Brunei
-
 Bulgaria
-
 Cambodia
-
 Cameroon
-
 Canada
-
 Chile
-
 China
-
 Colombia
-
 Congo
-
 Costa Rica
-
 Cote d'Ivoire
-
 Croatia
-
 Cuba
-
 Cyprus
-
 Czechia
-
 DR Congo
-
 Denmark
-
 Dominican Republic
-
 Ecuador
-
 Egypt
-
 El Salvador
-
 Estonia
-
 Eswatini
-
 Ethiopia
-
 Finland
-
 France
-
 Georgia
-
 Germany
-
 Ghana
-
 Greece
-
 Haiti
-
 Hong Kong
-
 Hungary
-
 India
-
 Indonesia
-
 Iran, Islamic republic
-
 Iraq
-
 Ireland
-
 Israel
-
 Italy
-
 Jamaica
-
 Japan
-
 Jordan
-
 Kazakhstan
-
 Kenya
-
 Korea
-
 Kuwait
-
 Kyrgyzstan
-
 Laos
-
 Latvia
-
 Lebanon
-
 Lesotho
-
 Libya
-
 Lithuania
-
 Luxembourg
-
 Madagascar
-
 Malaysia
-
 Malta
-
 Mauritius
-
 Mexico
-
 Moldova
-
 Mongolia
-
 Montenegro
-
 Morocco
-
 Mozambique
-
 Myanmar
-
 Namibia
-
 Nepal
-
 Netherlands
-
 New Zealand
-
 Nigeria
-
 North Macedonia
-
 Norway
-
 Oman
-
 Pakistan
-
 Palestine
-
 Panama
-
 Papua New Guinea
-
 Paraguay
-
 Peru
-
 Philippines
-
 Poland
-
 Portugal
-
 Puerto Rico
-
 Qatar
-
 Reunion
-
 Romania
-
 Rwanda
-
 Saudi Arabia
-
 Serbia
-
 Singapore
-
 Slovakia
-
 Slovenia
-
 Somalia
-
 South Africa
-
 Spain
-
 Sri Lanka
-
 Sweden
-
 Switzerland
-
 Syria
-
 Taiwan
-
 Tajikistan
-
 Tanzania
-
 Thailand
-
 Trinidad and Tobago
-
 Tunisia
-
 Turkey
-
 UAE
-
 Uganda
-
 Ukraine
-
 United Kingdom
-
United States
-
 Uruguay
-
 Uzbekistan
-
 Venezuela
-
 Vietnam
-
 Yemen
-
 Zambia
-
 Zimbabwe
- Forex
- Crypto












