

Why is Quantum Computing stock down 3.2% today?

Quantum Computing Inc. (QUBT) slid 3.24% as persistent selling pressure dominated the session amid the absence of a fresh catalyst. The down move is supported by the stock trading below all major moving averages, reinforcing the bearish technical structure.
 6.43
6.66
Highlights
- Quantum Computing stock trades below key moving averages, indicating persistent selling pressure across short, medium, and long timeframes.
- Price is currently at $7.91, having declined 3.24% for the session with significant intraday volatility at 7.27%.
- The stock is expected to remain rangebound between $7.56 and $8.26 in the next five trading days, with a 74% probability of a downward move.
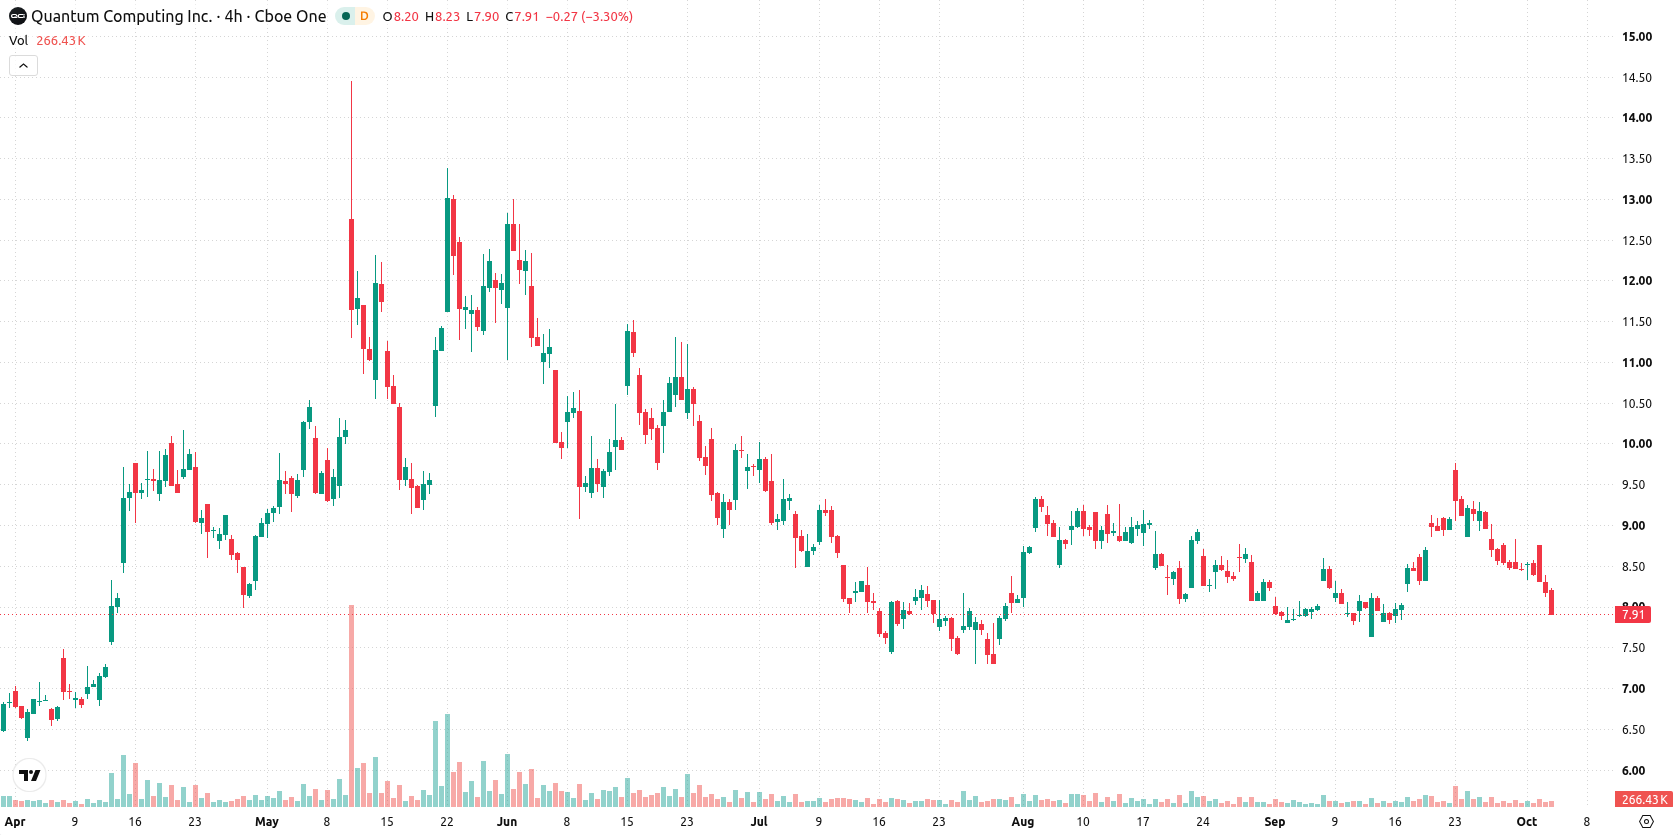
Mixed momentum signals amid bearish alignment and oversold conditions
Quantum Computing is trading below the MA-20 ($8.42), MA-50 ($8.43), and MA-200 ($9.18), indicating short-, medium-, and long-term pressure from sellers. The nearest support and resistance are seen at $7.56 and $8.12, with a bearish overall trend confirmed by the MA-50 vs MA-200 alignment. Momentum signals are mixed: the MACD calls for 'Strong Buy,' but the ADX is neutral at 10.9, reflecting the absence of strong trend direction. RSI is soft at 43.71, forecasting sell, and the Stochastic RSI is deeply oversold at 3.56, suggesting a potential rebound. CCI and Awesome Oscillator are neutral, while Bull/Bear Power is positive at 0.25, indicating buyers dominate intraday momentum, though daily price action remains negative. The stock is near the daily low with intraday volatility at 7.27%. Overall, intraday tone is pressured after the open and the divergence in signals highlights some indecision among market participants.
Earlier, analysts noted that Quantum Computing stock was under persistent selling pressure and maintained a broadly bearish outlook. The current analysis strengthens this view, as ongoing weakness below major moving averages highlights the importance of monitoring $7.56 as a critical downside risk in the coming sessions.






Latest Quantum Computing News





-
 Afghanistan
-
 Albania
-
 Algeria
-
 Angola
-
 Argentina
-
 Armenia
-
 Australia
-
 Austria
-
 Azerbaijan
-
 Bahamas
-
 Bahrain
-
 Bangladesh
-
 Belarus
-
 Belgium
-
 Bolivia
-
 Botswana
-
 Brazil
-
 Brunei
-
 Bulgaria
-
 Cambodia
-
 Cameroon
-
 Canada
-
 Chile
-
 China
-
 Colombia
-
 Congo
-
 Costa Rica
-
 Cote d'Ivoire
-
 Croatia
-
 Cuba
-
 Cyprus
-
 Czechia
-
 DR Congo
-
 Denmark
-
 Dominican Republic
-
 Ecuador
-
 Egypt
-
 El Salvador
-
 Estonia
-
 Eswatini
-
 Ethiopia
-
 Finland
-
 France
-
 Georgia
-
 Germany
-
 Ghana
-
 Greece
-
 Haiti
-
 Hong Kong
-
 Hungary
-
 India
-
 Indonesia
-
 Iran, Islamic republic
-
 Iraq
-
 Ireland
-
 Israel
-
 Italy
-
 Jamaica
-
 Japan
-
 Jordan
-
 Kazakhstan
-
 Kenya
-
 Korea
-
 Kuwait
-
 Kyrgyzstan
-
 Laos
-
 Latvia
-
 Lebanon
-
 Lesotho
-
 Libya
-
 Lithuania
-
 Luxembourg
-
 Madagascar
-
 Malaysia
-
 Malta
-
 Mauritius
-
 Mexico
-
 Moldova
-
 Mongolia
-
 Montenegro
-
 Morocco
-
 Mozambique
-
 Myanmar
-
 Namibia
-
 Nepal
-
 Netherlands
-
 New Zealand
-
 Nigeria
-
 North Macedonia
-
 Norway
-
 Oman
-
 Pakistan
-
 Palestine
-
 Panama
-
 Papua New Guinea
-
 Paraguay
-
 Peru
-
 Philippines
-
 Poland
-
 Portugal
-
 Puerto Rico
-
 Qatar
-
 Reunion
-
 Romania
-
 Rwanda
-
 Saudi Arabia
-
 Serbia
-
 Singapore
-
 Slovakia
-
 Slovenia
-
 Somalia
-
 South Africa
-
 Spain
-
 Sri Lanka
-
 Sweden
-
 Switzerland
-
 Syria
-
 Taiwan
-
 Tajikistan
-
 Tanzania
-
 Thailand
-
 Trinidad and Tobago
-
 Tunisia
-
 Turkey
-
 UAE
-
 Uganda
-
 Ukraine
-
 United Kingdom
-
United States
-
 Uruguay
-
 Uzbekistan
-
 Venezuela
-
 Vietnam
-
 Yemen
-
 Zambia
-
 Zimbabwe
- Forex
- Crypto












