

Upcoming Q3 2026 earnings pre-announcement: Can Goldman Sachs stock hold support?

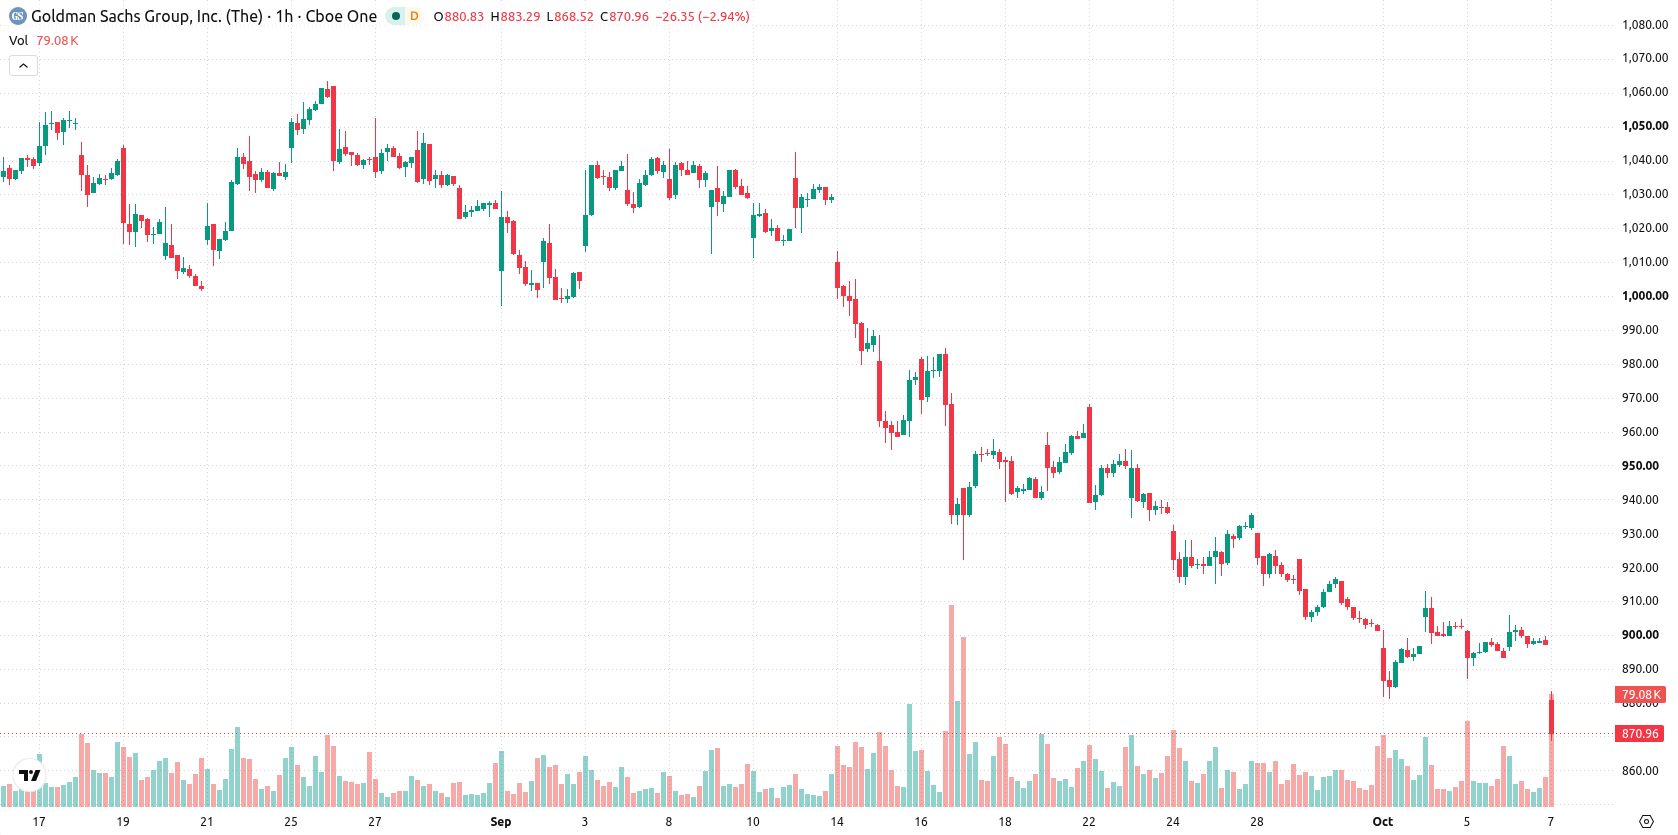
Goldman Sachs Group (GS) stock is trading at $872.47, down 2.75% on the day. The price remains below its key moving averages, reflecting the current downward momentum.
 904.11
939.28
Highlights
- Goldman Sachs Group will release Q3 2026 financial results before the market opens on October 13, drawing investor focus to upcoming performance data.
- The pending results increase near-term uncertainty and can contribute to heightened volatility in shares of Goldman Sachs.
- Shares of Goldman Sachs traded below key moving averages and support levels, with momentum indicators confirming ongoing selling pressure and pointing to a projected trading range of $858.27 to $886.67 in the next 2 to 3 days.
Earnings anticipation fuels volatility as investors reposition before results
Goldman Sachs Group is set to announce its Q3 2026 financial results before the market opens on October 13, according to MarketBeat. This scheduled earnings event draws investor attention to forthcoming performance figures and management commentary, often prompting adjustments in positioning ahead of the results. The approach of this key announcement heightens short-term uncertainty and may contribute to increased volatility in the stock.
Bearish signals persist as resistance holds and oscillators weaken
On the hourly chart, GS trades below the MA-20 at $898.16, the MA-50 at $903.32, and the long-term MA-200 at $959.93. Immediate resistance is seen at the Ichimoku Kijun level of $899.95, while support lies at $858.27. The MACD remains firmly in sell mode and the ADX shows strong bearish momentum. RSI is at 46.87 with a sell signal, Stochastic RSI also points to sell, and CCI is neutral. Bull/Bear Power indicates buyers retain intraday dominance, and the Awesome Oscillator is neutral.
Further declines seen likely as volatility and downside risks loom
In the next 2 to 3 trading days, GS is expected to remain volatile within a band of $858.27 to $886.67. There is a strong likelihood of further downside movement, while the probability of a rebound remains low. If GS pushes above the $899.95 resistance, an upward scenario would be in play, while a close below $858.27 would reinforce the bearish outlook.
Earlier, analysts noted that Goldman Sachs shares faced sustained downside risks amid bearish technical signals and mounting volatility. The upcoming Q3 2026 earnings announcement introduces fresh uncertainty that may amplify short-term volatility, making $858.27 a critical support level for traders to monitor.






Latest Goldman Sachs News




-
 Afghanistan
-
 Albania
-
 Algeria
-
 Angola
-
 Argentina
-
 Armenia
-
 Australia
-
 Austria
-
 Azerbaijan
-
 Bahamas
-
 Bahrain
-
 Bangladesh
-
 Belarus
-
 Belgium
-
 Bolivia
-
 Botswana
-
 Brazil
-
 Brunei
-
 Bulgaria
-
 Cambodia
-
 Cameroon
-
 Canada
-
 Chile
-
 China
-
 Colombia
-
 Congo
-
 Costa Rica
-
 Cote d'Ivoire
-
 Croatia
-
 Cuba
-
 Cyprus
-
 Czechia
-
 DR Congo
-
 Denmark
-
 Dominican Republic
-
 Ecuador
-
 Egypt
-
 El Salvador
-
 Estonia
-
 Eswatini
-
 Ethiopia
-
 Finland
-
 France
-
 Georgia
-
 Germany
-
 Ghana
-
 Greece
-
 Haiti
-
 Hong Kong
-
 Hungary
-
 India
-
 Indonesia
-
 Iran, Islamic republic
-
 Iraq
-
 Ireland
-
 Israel
-
 Italy
-
 Jamaica
-
 Japan
-
 Jordan
-
 Kazakhstan
-
 Kenya
-
 Korea
-
 Kuwait
-
 Kyrgyzstan
-
 Laos
-
 Latvia
-
 Lebanon
-
 Lesotho
-
 Libya
-
 Lithuania
-
 Luxembourg
-
 Madagascar
-
 Malaysia
-
 Malta
-
 Mauritius
-
 Mexico
-
 Moldova
-
 Mongolia
-
 Montenegro
-
 Morocco
-
 Mozambique
-
 Myanmar
-
 Namibia
-
 Nepal
-
 Netherlands
-
 New Zealand
-
 Nigeria
-
 North Macedonia
-
 Norway
-
 Oman
-
 Pakistan
-
 Palestine
-
 Panama
-
 Papua New Guinea
-
 Paraguay
-
 Peru
-
 Philippines
-
 Poland
-
 Portugal
-
 Puerto Rico
-
 Qatar
-
 Reunion
-
 Romania
-
 Rwanda
-
 Saudi Arabia
-
 Serbia
-
 Singapore
-
 Slovakia
-
 Slovenia
-
 Somalia
-
 South Africa
-
 Spain
-
 Sri Lanka
-
 Sweden
-
 Switzerland
-
 Syria
-
 Taiwan
-
 Tajikistan
-
 Tanzania
-
 Thailand
-
 Trinidad and Tobago
-
 Tunisia
-
 Turkey
-
 UAE
-
 Uganda
-
 Ukraine
-
 United Kingdom
-
United States
-
 Uruguay
-
 Uzbekistan
-
 Venezuela
-
 Vietnam
-
 Yemen
-
 Zambia
-
 Zimbabwe
- Forex
- Crypto












