

Support test for Scotiabank stock: Can BNS hold above C$111.96?

Scotiabank (BNS) stock is trading at C$125.73, down 1.93% on the day. The price remains below its key short- and medium-term moving averages, while holding above longer-term trends.
 132.78
134.44
Highlights
- Scotia Wealth Management introduced Scotia Global Intelligence to deliver aggregated account views and advanced portfolio analysis for ultra-high-net-worth clients.
- The platform uses technology from Addepar for account aggregation and Marsh for global investment guidance, aiming to differentiate in the competitive wealth segment.
- Shares of Scotiabank closed at C$125.73, down 1.93% on bearish technical momentum, with an expected trading range of C$124.1 to C$127.36 in the next few days.
Technology roll-out aims to counter selling as wealth unit targets elite clients
Scotia Wealth Management, a division of Scotiabank, launched Scotia Global Intelligence™, a new platform designed to deliver aggregated account views and advanced portfolio insights to ultra-high-net-worth clients, according to Theglobeandmail. The offering leverages a partnership with Addepar for account aggregation technology and Marsh for global investment guidance, representing a targeted effort to enhance client services and retain high-value relationships. Expanding into comprehensive multi-institutional portfolio management supports differentiation in the competitive wealth segment, though price action has remained under broader selling pressure.
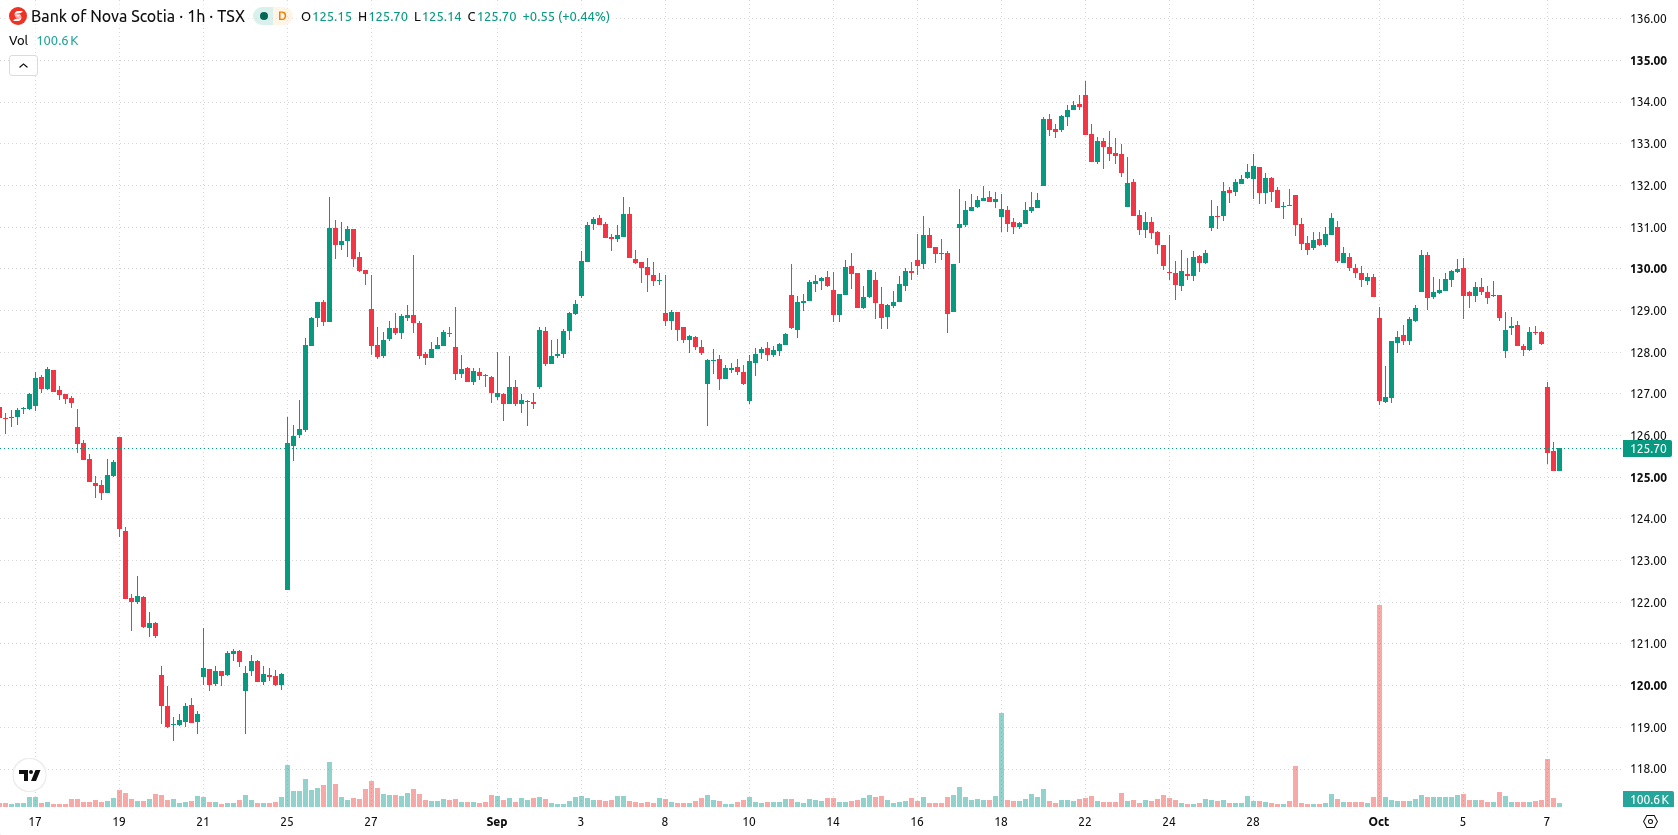
Momentum weakens as intraday sellers dominate below major resistance
On the hourly chart, BNS is trading below both the MA-20 at C$129.06 and MA-50 at C$129.76, with the Ichimoku Kijun at C$128.61 acting as immediate resistance. However, the stock sits above the long-term daily MA-200 anchored at C$111.96. Momentum indicators show broad negativity: MACD and ADX both indicate a sell bias, while RSI has slipped to 39.27 and CCI also signals sell. Stochastic RSI is neutral, with no clear overbought or oversold signal, and Bull/Bear Power suggests sellers are in control of intraday momentum. The Awesome Oscillator is neutral and does not currently reinforce either direction.
Downside risks remain elevated as reversal hinges on resistance break
Over the next 2 to 3 trading days, BNS is expected to trade within a range of C$124.1 to C$127.36, based on recent volatility. Downside probability remains high, while the chances of an upward reversal are limited. The baseline scenario sees price holding within this corridor. A bullish move could materialize only if price breaks above the C$128.61 resistance, while a breakdown below C$124.1 would confirm further downside risk.
Earlier, analysts noted that Scotiabank shares faced ongoing selling pressure and lacked clear trading momentum despite incremental capital actions and solid earnings. The current technical environment reinforces ongoing downside risk, with traders advised to monitor C$124.1 as the next key support level that could determine near-term direction.










-
 Afghanistan
-
 Albania
-
 Algeria
-
 Angola
-
 Argentina
-
 Armenia
-
 Australia
-
 Austria
-
 Azerbaijan
-
 Bahamas
-
 Bahrain
-
 Bangladesh
-
 Belarus
-
 Belgium
-
 Bolivia
-
 Botswana
-
 Brazil
-
 Brunei
-
 Bulgaria
-
 Cambodia
-
 Cameroon
-
 Canada
-
 Chile
-
 China
-
 Colombia
-
 Congo
-
 Costa Rica
-
 Cote d'Ivoire
-
 Croatia
-
 Cuba
-
 Cyprus
-
 Czechia
-
 DR Congo
-
 Denmark
-
 Dominican Republic
-
 Ecuador
-
 Egypt
-
 El Salvador
-
 Estonia
-
 Eswatini
-
 Ethiopia
-
 Finland
-
 France
-
 Georgia
-
 Germany
-
 Ghana
-
 Greece
-
 Haiti
-
 Hong Kong
-
 Hungary
-
 India
-
 Indonesia
-
 Iran, Islamic republic
-
 Iraq
-
 Ireland
-
 Israel
-
 Italy
-
 Jamaica
-
 Japan
-
 Jordan
-
 Kazakhstan
-
 Kenya
-
 Korea
-
 Kuwait
-
 Kyrgyzstan
-
 Laos
-
 Latvia
-
 Lebanon
-
 Lesotho
-
 Libya
-
 Lithuania
-
 Luxembourg
-
 Madagascar
-
 Malaysia
-
 Malta
-
 Mauritius
-
 Mexico
-
 Moldova
-
 Mongolia
-
 Montenegro
-
 Morocco
-
 Mozambique
-
 Myanmar
-
 Namibia
-
 Nepal
-
 Netherlands
-
 New Zealand
-
 Nigeria
-
 North Macedonia
-
 Norway
-
 Oman
-
 Pakistan
-
 Palestine
-
 Panama
-
 Papua New Guinea
-
 Paraguay
-
 Peru
-
 Philippines
-
 Poland
-
 Portugal
-
 Puerto Rico
-
 Qatar
-
 Reunion
-
 Romania
-
 Rwanda
-
 Saudi Arabia
-
 Serbia
-
 Singapore
-
 Slovakia
-
 Slovenia
-
 Somalia
-
 South Africa
-
 Spain
-
 Sri Lanka
-
 Sweden
-
 Switzerland
-
 Syria
-
 Taiwan
-
 Tajikistan
-
 Tanzania
-
 Thailand
-
 Trinidad and Tobago
-
 Tunisia
-
 Turkey
-
 UAE
-
 Uganda
-
 Ukraine
-
 United Kingdom
-
United States
-
 Uruguay
-
 Uzbekistan
-
 Venezuela
-
 Vietnam
-
 Yemen
-
 Zambia
-
 Zimbabwe
- Forex
- Crypto












