

ABX slips as weak momentum and support pressure weigh on the price

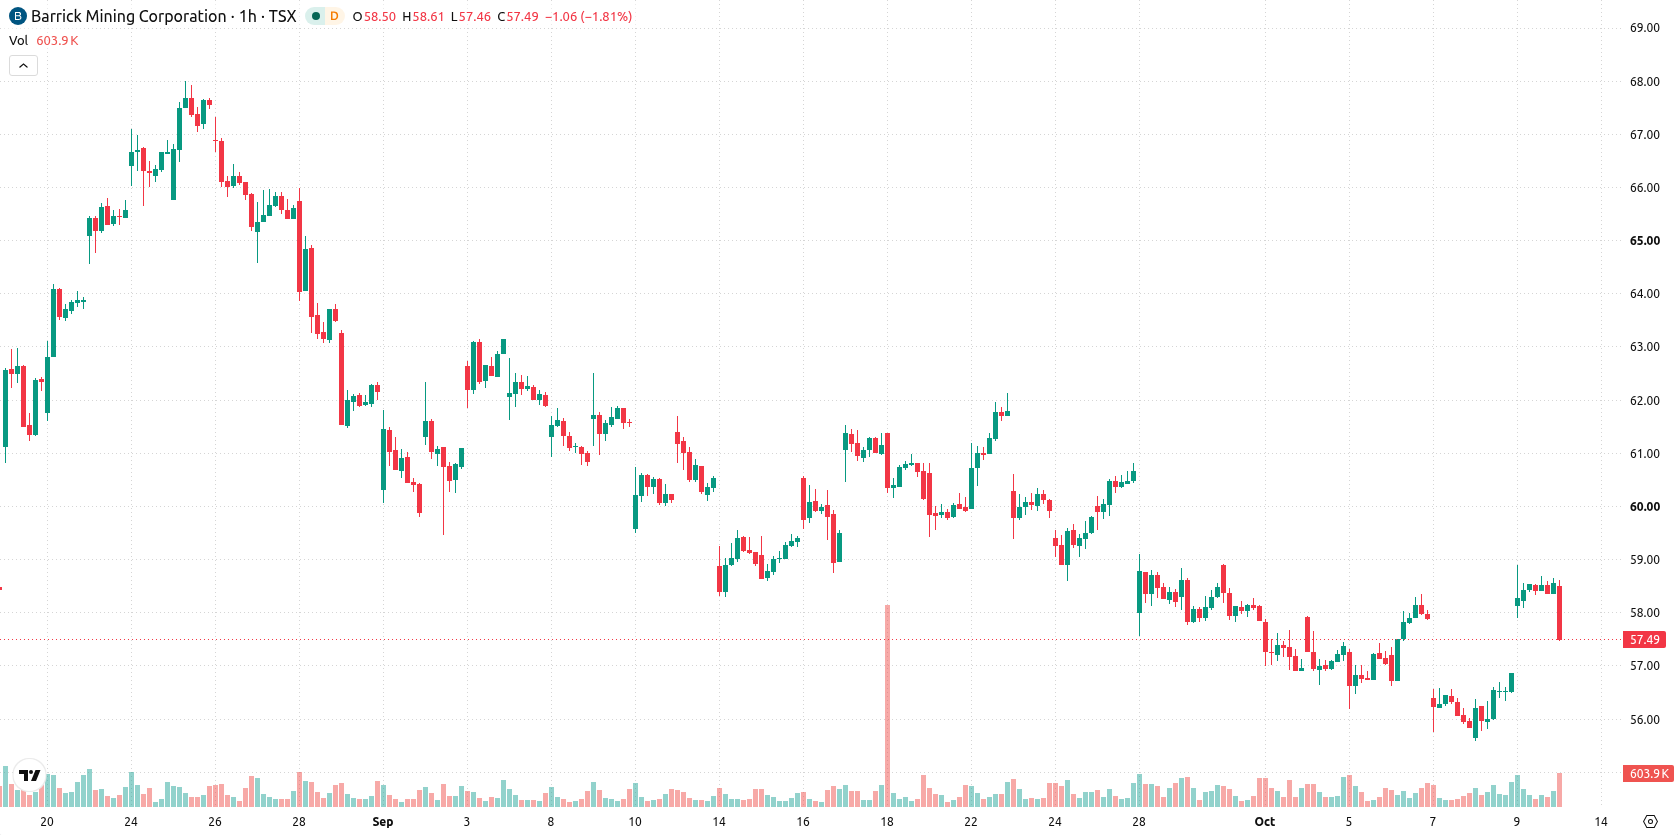
Barrick Gold (ABX) stock is trading at C$57.48, down 1.84% on the day. The price is currently positioned above its key short- and medium-term moving averages while remaining capped below the longer-term average.
 58.53
58.88
58.53
58.88
Highlights
- Barrick Gold stock is in a short-term bullish phase above key moving averages on the H1 timeframe but remains under long-term bearish pressure below the daily 200-day moving average.
- Momentum indicators present mixed signals with bullish cues from MACD, ADX, RSI, and CCI, while Stoch RSI shows the stock as strongly overbought and intraday price action stays weak.
- Barrick Gold stock is expected to trade within the C$56.04 to C$58.92 range, with a higher probability of short-term downside unless price breaks above resistance or below support.
Mixed bullish momentum as intraday buyers face resistance
On the H1 timeframe, ABX has moved above the MA-20 and MA-50 levels, while remaining below the MA-200 on the daily chart. Immediate support is defined by the Ichimoku Kijun at C$57.23. Momentum signals show a mixed technical setup: MACD, ADX, RSI, and CCI all reflect bullish cues, while Stochastic RSI is in strong overbought territory and Bull/Bear Power indicates significant buyer dominance within the intraday session. The Awesome Oscillator signal is neutral, adding neither bullish nor bearish confirmation to the current mix.
Further downside risk as volatility band contains direction
In the near term, ABX is expected to trade within the C$56.04 to C$58.92 volatility band as recent price action has stayed subdued. There is a 39% probability of an upward move, but a downward move is statistically favored in the short run. A breakout above C$58.92 would be needed for a sustained bullish scenario, while a close below C$56.04 would confirm further near-term downside risk.
Earlier, analysts noted that Barrick Gold was exhibiting short-term strength while remaining constrained by longer-term resistance. The current technical setup introduces greater downside risk in the near term, making a decisive break above C$58.92 the key level to monitor for any renewed bullish momentum.










-
 Afghanistan
-
 Albania
-
 Algeria
-
 Angola
-
 Argentina
-
 Armenia
-
 Australia
-
 Austria
-
 Azerbaijan
-
 Bahamas
-
 Bahrain
-
 Bangladesh
-
 Belarus
-
 Belgium
-
 Bolivia
-
 Botswana
-
 Brazil
-
 Brunei
-
 Bulgaria
-
 Cambodia
-
 Cameroon
-
 Canada
-
 Chile
Chile
-
 China
China
-
 Colombia
-
 Congo
Congo
-
 Costa Rica
-
 Cote d'Ivoire
-
 Croatia
-
 Cuba
Cuba
-
 Cyprus
-
 Czechia
-
 DR Congo
-
 Denmark
-
 Dominican Republic
-
 Ecuador
-
 Egypt
Egypt
-
 El Salvador
-
 Estonia
-
 Eswatini
-
 Ethiopia
-
 Finland
-
 France
-
 Georgia
-
 Germany
-
 Ghana
Ghana
-
 Greece
-
 Haiti
Haiti
-
 Hong Kong
-
 Hungary
-
 India
India
-
 Indonesia
-
 Iran, Islamic republic
-
 Iraq
Iraq
-
 Ireland
-
 Israel
-
 Italy
Italy
-
 Jamaica
-
 Japan
Japan
-
 Jordan
-
 Kazakhstan
-
 Kenya
Kenya
-
 Korea
Korea
-
 Kuwait
-
 Kyrgyzstan
-
 Laos
Laos
-
 Latvia
-
 Lebanon
-
 Lesotho
-
 Libya
Libya
-
 Lithuania
-
 Luxembourg
-
 Madagascar
-
 Malaysia
-
 Malta
Malta
-
 Mauritius
-
 Mexico
-
 Moldova
-
 Mongolia
-
 Montenegro
-
 Morocco
-
 Mozambique
-
 Myanmar
-
 Namibia
-
 Nepal
Nepal
-
 Netherlands
-
 New Zealand
-
 Nigeria
-
 North Macedonia
-
 Norway
-
 Oman
Oman
-
 Pakistan
-
 Palestine
-
 Panama
-
 Papua New Guinea
-
 Paraguay
-
 Peru
Peru
-
 Philippines
-
 Poland
-
 Portugal
-
 Puerto Rico
-
 Qatar
Qatar
-
 Reunion
-
 Romania
-
 Rwanda
-
 Saudi Arabia
-
 Serbia
-
 Singapore
-
 Slovakia
-
 Slovenia
-
 Somalia
-
 South Africa
-
 Spain
Spain
-
 Sri Lanka
-
 Sweden
-
 Switzerland
-
 Syria
Syria
-
 Taiwan
-
 Tajikistan
-
 Tanzania
-
 Thailand
-
 Trinidad and Tobago
-
 Tunisia
-
 Turkey
-
 UAE
UAE
-
 Uganda
-
 Ukraine
-
 United Kingdom
-
United States
-
 Uruguay
-
 Uzbekistan
-
 Venezuela
-
 Vietnam
-
 Yemen
Yemen
-
 Zambia
-
 Zimbabwe
- Forex
- Crypto












