

IBM stock faces resistance at 50-day moving average as advance slows: weekly analysis

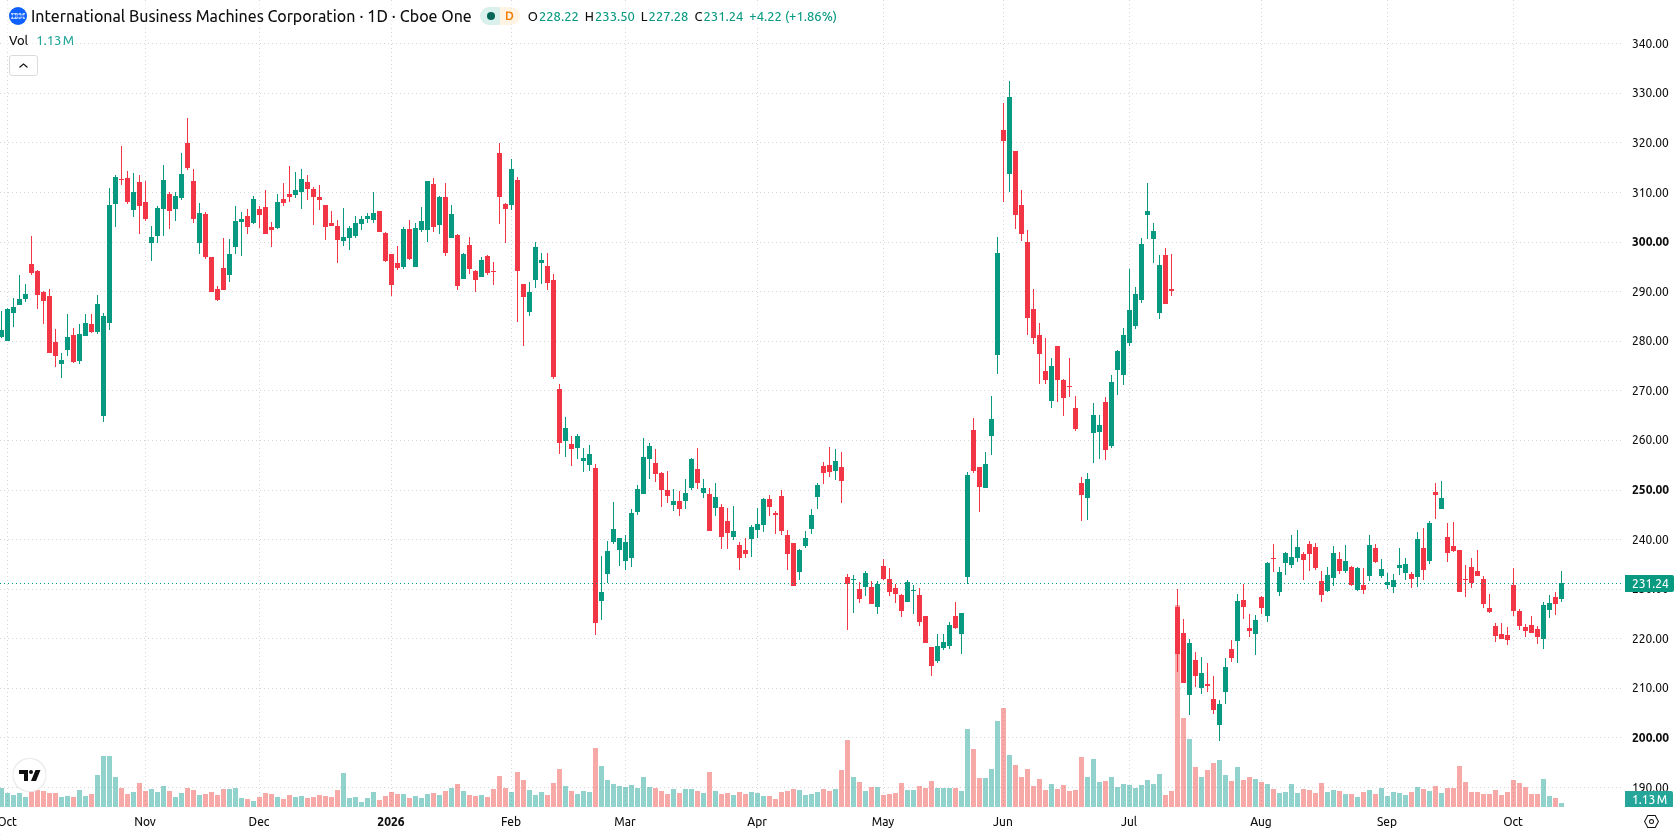
Shares of International Business Machines Corporation (IBM) are trading near $232 after gaining around 2% this week as buyers pushed prices higher. Technical signals now look stretched, with mixed momentum indicators and resistance levels containing further upside potential. The coming week will test whether IBM can sustain this move or enters consolidation.
 233.50
229.29
233.50
229.29
Highlights
- Shares of IBM rose $4.57 over the past 7 days to $231.67, trading just below short-term resistance.
- Technical indicators show a mixed outlook, with most signals neutral but Stochastic RSI registering overbought conditions.
- The expected price range for the coming week is $225.74 to $236.62, with consolidation likely between $229.29 and $232.16.
Revenue and margin risks intensify as delayed deals meet new SAP partnership
IBM saw delays in closing major mainframe and software deals expected by year-end, contributing to revenue pressures and margin concerns, according to Pluang. Despite these headwinds, IBM remains focused on productivity enhancements to support its margin targets, while maintaining its dividend outlook. The company also introduced 'IBM Ready for SAP Solutions' to drive ERP modernization through a new partnership with SAP, as reported by The Globe and Mail and GuruFocus. Institutional activity included Mn Services Vermogensbeheer B.V. increasing its stake by 4,900 shares and Congress Asset Management Co. cutting its IBM position by 18.2% in the third quarter (source: Defense World).
Narrow range persists as 50-day cap coincides with overbought momentum
On the daily chart, IBM stock is sitting on resistance at the 50-day moving average while momentum signals present a mixed backdrop. RSI and CCI both register in the neutral zone, but Stochastic RSI is firmly overbought at 100. Volatility over the past week measured 5.08%, and price action reflects a contained move within a narrow range. Nearest support lies at $229.29, with additional resistance from the Ichimoku Kijun at $234.98.
Consolidation favored over the week as downside probability dominates
For the coming trading week, the expected range is $225.74 to $236.62. The probability of an increase stands at 26%, while the likelihood of a decrease is 74%. The base case is for continued consolidation between $229.29 and $232.16. A bullish scenario would require a sustained break above $232.16, targeting $234.98. If the stock falls below $229.29, a move toward the lower end of the expected range becomes more probable.
Earlier, analysts noted that IBM's long-term outlook was supported by advances in AI and quantum technology, but macroeconomic headwinds and resistance levels limited near-term upside. The current technical setup reinforces this cautious stance, with consolidation likely to persist unless a clear break above $232.16 or below $229.29 signals the next directional move.










-
 Afghanistan
-
 Albania
-
 Algeria
-
 Angola
-
 Argentina
-
 Armenia
-
 Australia
-
 Austria
-
 Azerbaijan
-
 Bahamas
-
 Bahrain
-
 Bangladesh
-
 Belarus
-
 Belgium
-
 Bolivia
-
 Botswana
-
 Brazil
-
 Brunei
-
 Bulgaria
-
 Cambodia
-
 Cameroon
-
 Canada
-
 Chile
Chile
-
 China
China
-
 Colombia
-
 Congo
Congo
-
 Costa Rica
-
 Cote d'Ivoire
-
 Croatia
-
 Cuba
Cuba
-
 Cyprus
-
 Czechia
-
 DR Congo
-
 Denmark
-
 Dominican Republic
-
 Ecuador
-
 Egypt
Egypt
-
 El Salvador
-
 Estonia
-
 Eswatini
-
 Ethiopia
-
 Finland
-
 France
-
 Georgia
-
 Germany
-
 Ghana
Ghana
-
 Greece
-
 Haiti
Haiti
-
 Hong Kong
-
 Hungary
-
 India
India
-
 Indonesia
-
 Iran, Islamic republic
-
 Iraq
Iraq
-
 Ireland
-
 Israel
-
 Italy
Italy
-
 Jamaica
-
 Japan
Japan
-
 Jordan
-
 Kazakhstan
-
 Kenya
Kenya
-
 Korea
Korea
-
 Kuwait
-
 Kyrgyzstan
-
 Laos
Laos
-
 Latvia
-
 Lebanon
-
 Lesotho
-
 Libya
Libya
-
 Lithuania
-
 Luxembourg
-
 Madagascar
-
 Malaysia
-
 Malta
Malta
-
 Mauritius
-
 Mexico
-
 Moldova
-
 Mongolia
-
 Montenegro
-
 Morocco
-
 Mozambique
-
 Myanmar
-
 Namibia
-
 Nepal
Nepal
-
 Netherlands
-
 New Zealand
-
 Nigeria
-
 North Macedonia
-
 Norway
-
 Oman
Oman
-
 Pakistan
-
 Palestine
-
 Panama
-
 Papua New Guinea
-
 Paraguay
-
 Peru
Peru
-
 Philippines
-
 Poland
-
 Portugal
-
 Puerto Rico
-
 Qatar
Qatar
-
 Reunion
-
 Romania
-
 Rwanda
-
 Saudi Arabia
-
 Serbia
-
 Singapore
-
 Slovakia
-
 Slovenia
-
 Somalia
-
 South Africa
-
 Spain
Spain
-
 Sri Lanka
-
 Sweden
-
 Switzerland
-
 Syria
Syria
-
 Taiwan
-
 Tajikistan
-
 Tanzania
-
 Thailand
-
 Trinidad and Tobago
-
 Tunisia
-
 Turkey
-
 UAE
UAE
-
 Uganda
-
 Ukraine
-
 United Kingdom
-
United States
-
 Uruguay
-
 Uzbekistan
-
 Venezuela
-
 Vietnam
-
 Yemen
Yemen
-
 Zambia
-
 Zimbabwe
- Forex
- Crypto












