

Nvidia stock falls as seller pressure keeps price below short- and medium-term averages

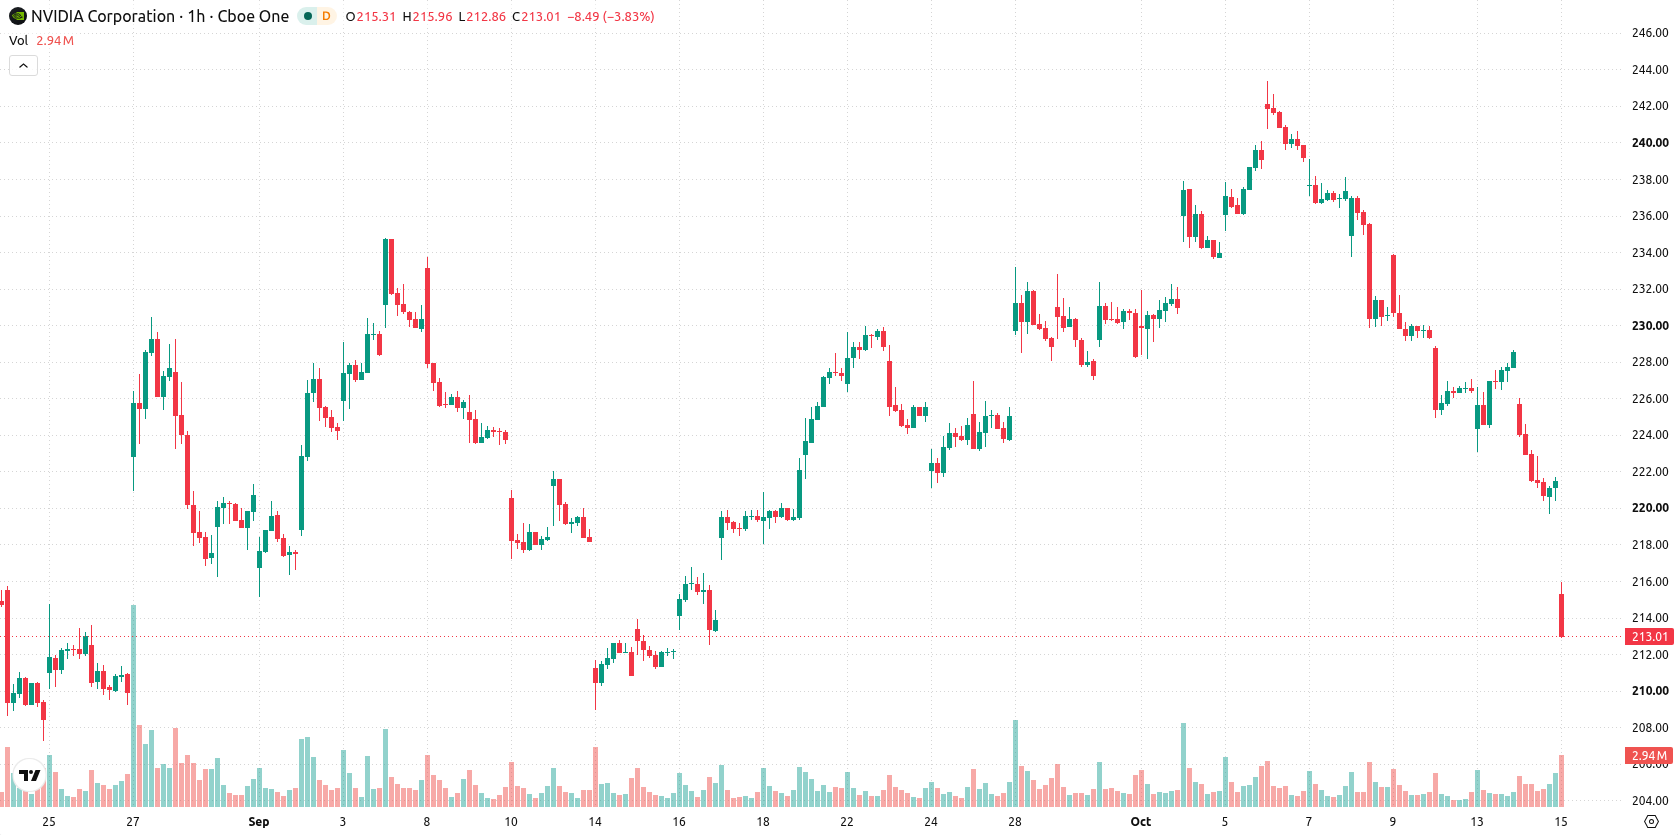
Nvidia (NVDA) stock is trading at $215.4, down 2.75% on the day. The price is currently below its key short- and medium-term moving averages, while staying above its long-term average.
 218.45
225.96
Highlights
- Nvidia will allocate $250 million in computing resources over five years to support AI safety and security research in the UK.
- This investment increases access to advanced hardware for UK research institutions and strengthens Nvidia's role in responsible AI development.
- Shares of Nvidia declined 2.75% to $215.4 and face persistent bearish momentum, with expected trading between $210.06 and $221.21 in the coming days.
UK research initiative expands Nvidia’s reach amid persistent selling
Nvidia has pledged $250 million in computing resources over five years to support artificial intelligence safety and security research in the United Kingdom, providing $50 million of annual access, according to Gurufocus. This commitment increases the availability of advanced hardware for UK-based research institutions and reinforces Nvidia's role in fostering responsible AI development. The initiative expands the company’s global reach, though price action has remained under broader selling pressure.
Entrenched bearish momentum as price stalls near oversold zone
On the hourly chart, NVDA has slipped below both the MA-20 at $224.86 and the MA-50 at $229.82, yet maintains its position above the daily MA-200 at $202.69. The Ichimoku Kijun at $224.84 acts as immediate resistance. Momentum indicators signal entrenched bearish momentum: MACD and ADX show Sell signals, while RSI stands at a deeply oversold 30.03. Both CCI and Stochastic RSI confirm the oversold condition, with Bull/Bear Power reflecting seller dominance in intraday trading. The Awesome Oscillator is currently neutral, offering no support to either direction, and there is noticeable divergence as most momentum and oscillators remain negative despite the price stabilizing near the day's range high.
Volatility band limits rebound unless resistance decisively breached
Over the next several days, NVDA is expected to remain confined within a volatility-constrained corridor between $210.06 and $221.21. Probability analysis suggests a very high likelihood of continued downside or sideways trading, while the chance of a sustained upward move appears much lower in the short term. A break above resistance near $224.84 on higher volume would be needed to initiate a bullish scenario, whereas a clear move below $210.06 would likely trigger further selling. Until such levels are breached, the baseline scenario sees NVDA persisting within this typical volatility band relative to current levels.
Earlier, analysts noted that Nvidia’s strong revenue growth and continued AI sector leadership had already been largely priced into the stock, prompting a more measured outlook on near-term gains. With the current technical setup indicating entrenched bearish momentum and volatility capped within a defined range, traders should monitor $210.06 and $224.84 as the principal levels for a potential move out of consolidation.









-
 Afghanistan
-
 Albania
-
 Algeria
-
 Angola
-
 Argentina
-
 Armenia
-
 Australia
-
 Austria
-
 Azerbaijan
-
 Bahamas
-
 Bahrain
-
 Bangladesh
-
 Belarus
-
 Belgium
-
 Bolivia
-
 Botswana
-
 Brazil
-
 Brunei
-
 Bulgaria
-
 Cambodia
-
 Cameroon
-
 Canada
-
 Chile
-
 China
-
 Colombia
-
 Congo
-
 Costa Rica
-
 Cote d'Ivoire
-
 Croatia
-
 Cuba
-
 Cyprus
-
 Czechia
-
 DR Congo
-
 Denmark
-
 Dominican Republic
-
 Ecuador
-
 Egypt
-
 El Salvador
-
 Estonia
-
 Eswatini
-
 Ethiopia
-
 Finland
-
 France
-
 Georgia
-
 Germany
-
 Ghana
-
 Greece
-
 Haiti
-
 Hong Kong
-
 Hungary
-
 India
-
 Indonesia
-
 Iran, Islamic republic
-
 Iraq
-
 Ireland
-
 Israel
-
 Italy
-
 Jamaica
-
 Japan
-
 Jordan
-
 Kazakhstan
-
 Kenya
-
 Korea
-
 Kuwait
-
 Kyrgyzstan
-
 Laos
-
 Latvia
-
 Lebanon
-
 Lesotho
-
 Libya
-
 Lithuania
-
 Luxembourg
-
 Madagascar
-
 Malaysia
-
 Malta
-
 Mauritius
-
 Mexico
-
 Moldova
-
 Mongolia
-
 Montenegro
-
 Morocco
-
 Mozambique
-
 Myanmar
-
 Namibia
-
 Nepal
-
 Netherlands
-
 New Zealand
-
 Nigeria
-
 North Macedonia
-
 Norway
-
 Oman
-
 Pakistan
-
 Palestine
-
 Panama
-
 Papua New Guinea
-
 Paraguay
-
 Peru
-
 Philippines
-
 Poland
-
 Portugal
-
 Puerto Rico
-
 Qatar
-
 Reunion
-
 Romania
-
 Rwanda
-
 Saudi Arabia
-
 Serbia
-
 Singapore
-
 Slovakia
-
 Slovenia
-
 Somalia
-
 South Africa
-
 Spain
-
 Sri Lanka
-
 Sweden
-
 Switzerland
-
 Syria
-
 Taiwan
-
 Tajikistan
-
 Tanzania
-
 Thailand
-
 Trinidad and Tobago
-
 Tunisia
-
 Turkey
-
 UAE
-
 Uganda
-
 Ukraine
-
 United Kingdom
-
United States
-
 Uruguay
-
 Uzbekistan
-
 Venezuela
-
 Vietnam
-
 Yemen
-
 Zambia
-
 Zimbabwe
- Forex
- Crypto












