

SNDL stock remains steady as buyer support emerges around $1.21

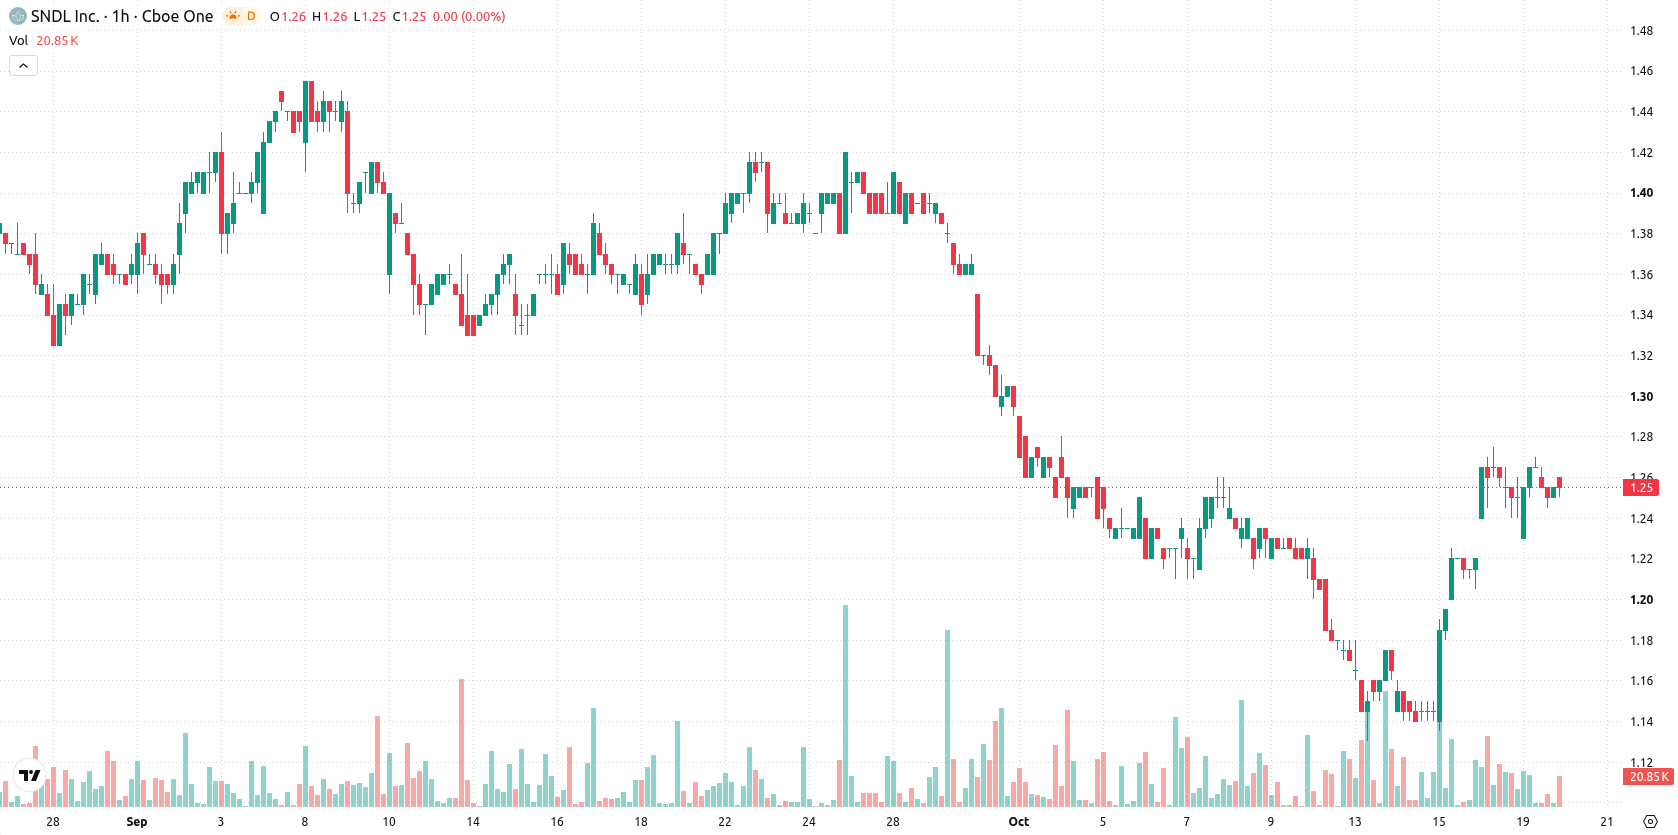
SNDL Inc. (SNDL) stock is trading at $1.25, showing a modest decline today. The price currently sits above its key short- and medium-term moving averages but remains below longer-term trend levels.
 1.36
1.34
Highlights
- SNDL/USD shows moderate short- and medium-term bullish momentum but remains under longer-term bearish pressure.
- Buyers currently dominate intraday but mixed signals from oversold oscillators and neutral indicators indicate market indecision.
- For the next 2 to 3 days, SNDL/USD is expected to trade between $1.19 and $1.31 with a 55% probability of moving higher.
Technical boundaries diverge as momentum indicators show mild bullish bias
On the hourly chart, SNDL is trading above the MA-20 at $1.25 and the MA-50 at $1.21, while it remains under the MA-200 at $1.41. The Ichimoku Kijun at $1.21 acts as immediate support, with momentum signals such as MACD and ADX in buy mode, and RSI at 57.97 indicating mild bullishness. Stoch RSI shows the stock as oversold, and CCI is neutral, while Bull/Bear Power reveals intraday buyer dominance. The Awesome Oscillator is neutral, suggesting that not all momentum indicators are aligned.
Slight upside edge as price expected to consolidate within range
Over the next two to three trading days, price is expected to fluctuate within a $1.19 to $1.31 range. There is a 55% probability of an upward move, slightly higher than the 45% probability of a downward move. Sideways action within this band is the baseline scenario, with a break above resistance targeting the upper end of the range, while a break below support could open the door for further downside.
Earlier, analysts noted that short-term bullish momentum in SNDL was building, with a breakout scenario dependent on sustained buying pressure. The latest market action reinforces this view, as technical indicators favor continued consolidation, making a decisive move outside the $1.19–$1.31 range the primary catalyst to monitor in the coming sessions.









-
 Afghanistan
-
 Albania
-
 Algeria
-
 Angola
-
 Argentina
-
 Armenia
-
 Australia
-
 Austria
-
 Azerbaijan
-
 Bahamas
-
 Bahrain
-
 Bangladesh
-
 Belarus
-
 Belgium
-
 Bolivia
-
 Botswana
-
 Brazil
-
 Brunei
-
 Bulgaria
-
 Cambodia
-
 Cameroon
-
 Canada
-
 Chile
-
 China
-
 Colombia
-
 Congo
-
 Costa Rica
-
 Cote d'Ivoire
-
 Croatia
-
 Cuba
-
 Cyprus
-
 Czechia
-
 DR Congo
-
 Denmark
-
 Dominican Republic
-
 Ecuador
-
 Egypt
-
 El Salvador
-
 Estonia
-
 Eswatini
-
 Ethiopia
-
 Finland
-
 France
-
 Georgia
-
 Germany
-
 Ghana
-
 Greece
-
 Haiti
-
 Hong Kong
-
 Hungary
-
 India
-
 Indonesia
-
 Iran, Islamic republic
-
 Iraq
-
 Ireland
-
 Israel
-
 Italy
-
 Jamaica
-
 Japan
-
 Jordan
-
 Kazakhstan
-
 Kenya
-
 Korea
-
 Kuwait
-
 Kyrgyzstan
-
 Laos
-
 Latvia
-
 Lebanon
-
 Lesotho
-
 Libya
-
 Lithuania
-
 Luxembourg
-
 Madagascar
-
 Malaysia
-
 Malta
-
 Mauritius
-
 Mexico
-
 Moldova
-
 Mongolia
-
 Montenegro
-
 Morocco
-
 Mozambique
-
 Myanmar
-
 Namibia
-
 Nepal
-
 Netherlands
-
 New Zealand
-
 Nigeria
-
 North Macedonia
-
 Norway
-
 Oman
-
 Pakistan
-
 Palestine
-
 Panama
-
 Papua New Guinea
-
 Paraguay
-
 Peru
-
 Philippines
-
 Poland
-
 Portugal
-
 Puerto Rico
-
 Qatar
-
 Reunion
-
 Romania
-
 Rwanda
-
 Saudi Arabia
-
 Serbia
-
 Singapore
-
 Slovakia
-
 Slovenia
-
 Somalia
-
 South Africa
-
 Spain
-
 Sri Lanka
-
 Sweden
-
 Switzerland
-
 Syria
-
 Taiwan
-
 Tajikistan
-
 Tanzania
-
 Thailand
-
 Trinidad and Tobago
-
 Tunisia
-
 Turkey
-
 UAE
-
 Uganda
-
 Ukraine
-
 United Kingdom
-
United States
-
 Uruguay
-
 Uzbekistan
-
 Venezuela
-
 Vietnam
-
 Yemen
-
 Zambia
-
 Zimbabwe
- Forex
- Crypto












