Volume Spread Analysis (VSA) | All You Need To Know
Volume Spread Analysis (VSA) is a powerful trading methodology that focuses on the relationship between volume and price action to understand market dynamics and identify trading opportunities. The top VSA strategies are: No Demand Bars, No Supply Bars, Buying Climax, etc.
Volume Spread Analysis provides traders with valuable tools to understand market dynamics, anticipate price movements, and improve their trading strategies. VSA offers enhanced market timing, trend confirmation, and risk management capabilities across various markets and timeframes.
Candlestick patterns and VSA trading signals can be very profitable, but their success often depends on how they are used and in what context they are applied. In this article, we will tell you about VSA strategies that can significantly improve your trading performance.
Here are some of the top strategies:
-
No Demand Bars: the market may not continue to rise;
-
No Supply Bars: this signals a potential buying opportunity;
-
Climax reversal strategy: Indicates the end of the current trend and the beginning of a new market phase;
-
Upthrusts and Springs: Springs are the opposite, where prices dip below support but then rise, signaling bullish pressure;
-
Tests for Supply and Demand: A successful test indicates the absence of selling or buying pressure, confirming the trend.
What is the Volume Price Analysis Method?
VSA focuses on the dynamics of supply and demand in the market, identifying the activities of professional traders who often leave "footprints" in volume data.
When demand exceeds supply, prices tend to rise. Conversely, when supply exceeds demand, prices tend to fall. VSA helps traders understand these dynamics by analyzing volume (the number of shares traded) and price spreads (the difference between the high and low prices within a trading period).
Example:
-
High Volume on a Price Rise: If a stock price rises on high volume, it indicates strong demand. Professional traders might be buying, expecting the price to continue rising.
-
Low Volume on a Price Rise: If the price rises on low volume, it indicates weak demand. This might be a sign that professional traders are not interested, suggesting the price rise could be unsustainable.
Note:
Professional traders and institutions often have significant capital to influence market movements. VSA helps identify their activities through specific patterns in volume and price.
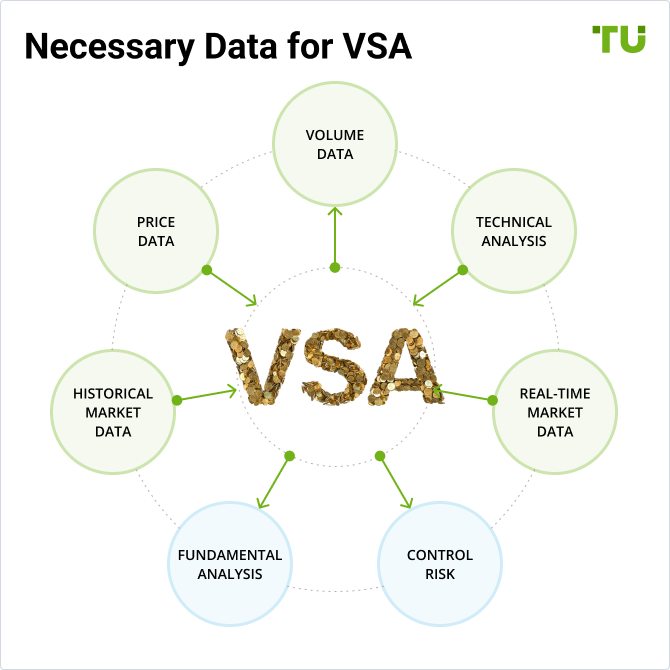
Necessary Data for VSA
To use VSA effectively, traders need accurate volume and price data, as well as analyzing the relationship between the two. Let us remind you exactly what you need and where to get it.
Volume Data
Volume data represents the number of shares, contracts, or lots traded in a specific period. It is crucial for VSA as it helps in identifying the level of activity and the presence of professional traders in the market.
-
Total Volume: The total amount of trading activity for a given period.
-
Bid and Ask Volume: The volume of buy orders (bid) and sell orders (ask), which helps in understanding market pressure.
Price Data
Price data includes the opening, high, low, and closing prices for a specific period. This data helps in determining the price spread and understanding market sentiment.
-
OHLC price: Essential for analyzing price movements and spreads.
-
Price Spread: The difference between the high and low prices within a period.
Historical and Real-Time Market Data
Historical data is crucial for backtesting VSA strategies and understanding how volume and price have interacted over time.Real-Time data is essential for making timely trading decisions based on VSA signals.
Sources
-
Stock Exchanges: Major stock exchanges like NYSE, NASDAQ, and others provide real-time volume data. Exchanges provide detailed price data for listed securities;
-
Brokerage Platforms: Most brokerage platforms offer volume data for various assets. Examples include TD Ameritrade, E*TRADE, and Interactive Brokers. Most trading platforms offer OHLC data for various timeframes. Examples include MetaTrader, Thinkorswim, and TradingView;
-
Data Providers: Specialized financial data providers like Bloomberg, Reuters, and Morningstar offer comprehensive volume data;
-
Financial Websites: Websites like Yahoo Finance, Google Finance, and Investing.com provide free access to price data.
Necessary Data for VSA
Basic Candlestick Patterns of VSA
Recognizing these patterns helps traders interpret market conditions and make informed decisions.
Accumulation: This occurs when professional traders are buying large quantities of a security without significantly moving the price. This often happens over a period where the volume is high, but the price spread is narrow.
Example: A stock trading in a narrow range with high volume might indicate accumulation. Professionals are buying, anticipating a future price rise.
Distribution: This happens when professional traders are selling large quantities of a security. Similar to accumulation, this occurs with high volume but a narrow price spread.
Example: A stock in a narrow range with high volume after a significant uptrend might indicate distribution. Professionals are selling, expecting a price decline.
Buying Climax: This is characterized by a sharp price increase on high volume, followed by a reversal. It indicates the end of a bullish trend and the beginning of a bearish phase.
Example: A stock that rises rapidly with increasing volume but then reverses sharply can signal a buying climax. Professionals are selling their holdings, causing the reversal.
Selling Climax: The opposite of a buying climax, where a sharp price decline with high volume is followed by a reversal, indicating the end of a bearish trend.
Example: A stock that falls rapidly with increasing volume but then reverses sharply can signal a selling climax. Professionals are buying, expecting the price to rise.
Wide Spread with High Volume: Indicates strong market activity and the potential for significant price movement.
Example: If a stock has a wide price spread and high volume, it indicates strong buying or selling pressure. Analyzing whether the price closed higher or lower can help determine if demand or supply is dominant.
Narrow Spread with High Volume: Suggests market uncertainty or a potential turning point.
Example: A stock with a narrow spread and high volume after a trend could indicate that professionals are undecided, possibly preparing for a reversal.
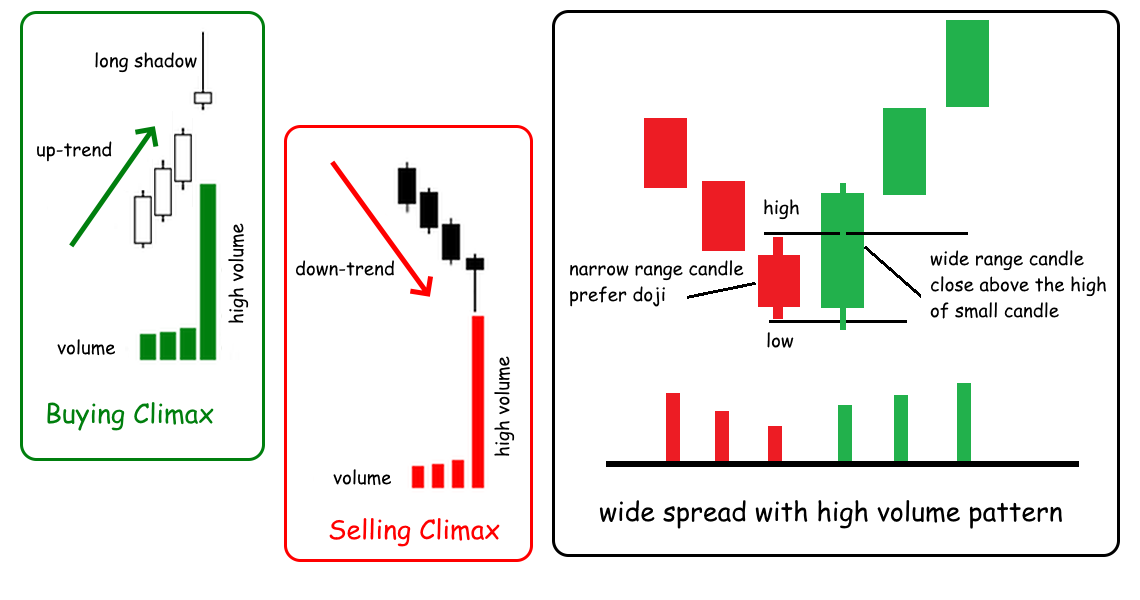
Example of standard VSA patterns
Volume Spread Analysis trading signals are especially effective when used in conjunction with other technical indicators, backed by thorough backtesting and ongoing training.
VSA provides various trading signals, such as confirming breakouts with volume, identifying trend reversals, and spotting divergence between price and volume.
When choosing a broker comfortable for VSA trades, pay attention to the possibility of scalping and algorithmic trading - all volume analysis strategies are perfectly automated. Also look for a platform with low spreads and no hidden commissions. For example:
| Broker | Demo | Deposit (USD) | Scalping | Trading bots (EAs) | Deposit fee % | Withdrawal fee % |
|---|---|---|---|---|---|---|
1 |
0 |
0 |
||||
100 |
0 |
0 |
||||
0 |
0 |
0 |
Basic VSA Strategies
Here are some of the top strategies:
-
No Demand Bars: the market may not continue to rise;
-
No Supply Bars: this signals a potential buying opportunity;
-
Buying Climax: It indicates the end of a bullish trend and the beginning of a bearish phase;
-
Selling Climax: This signals the end of a bearish trend;
-
Upthrusts and Springs: Springs are the opposite, where prices dip below support but then rise, signaling bullish pressure;
-
Tests for Supply and Demand: A successful test indicates the absence of selling or buying pressure, confirming the trend.
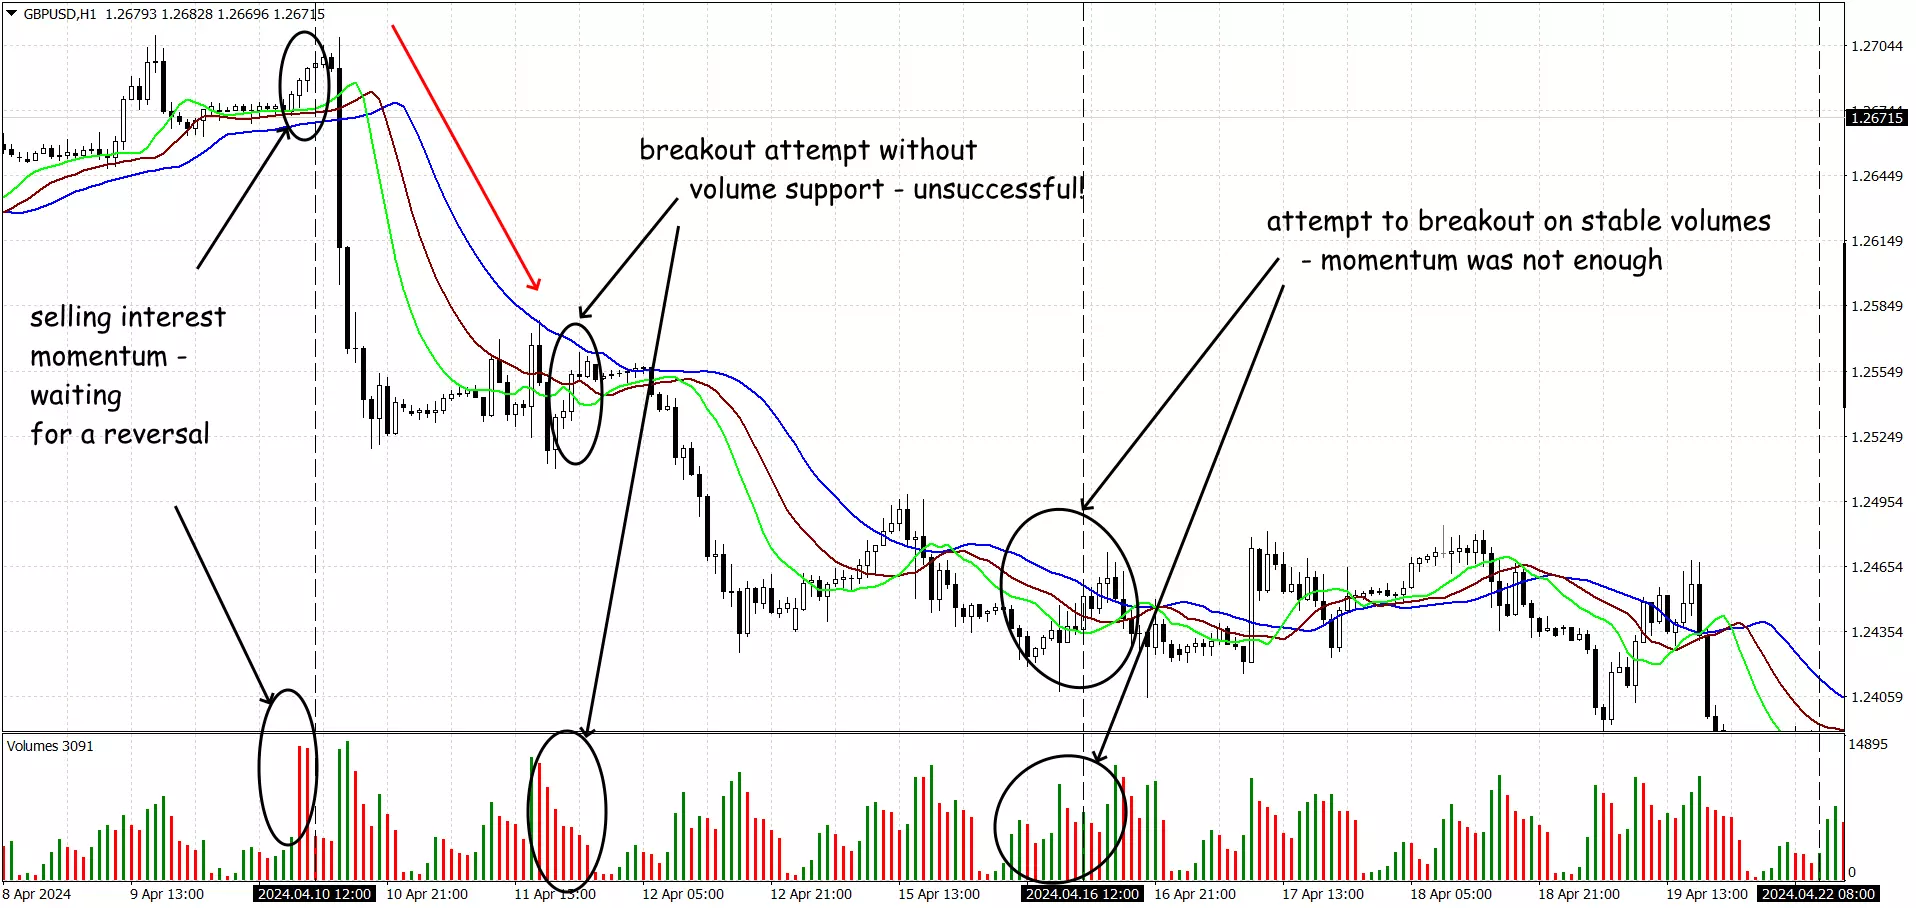
No Demand Bars/No Supply Bars Strategy
Look for no demand or no supply bars to identify potential turning points. Combine these signals with the overall market trend for higher accuracy.
-
No Demand Bars: When the market rises on low volume, indicating a lack of interest from buyers. This often precedes a price decline. Example: If a stock price rises but the volume is significantly lower than average, it signals no demand, suggesting a potential bearish move.
-
No Supply Bars: When the market falls on low volume, indicating a lack of selling pressure. This often precedes a price rise. Example: If a stock price falls but the volume is significantly lower than average, it signals no supply, suggesting a potential bullish move.
VSA helps traders understand market mechanics by highlighting the supply and demand imbalances that professional traders exploit.
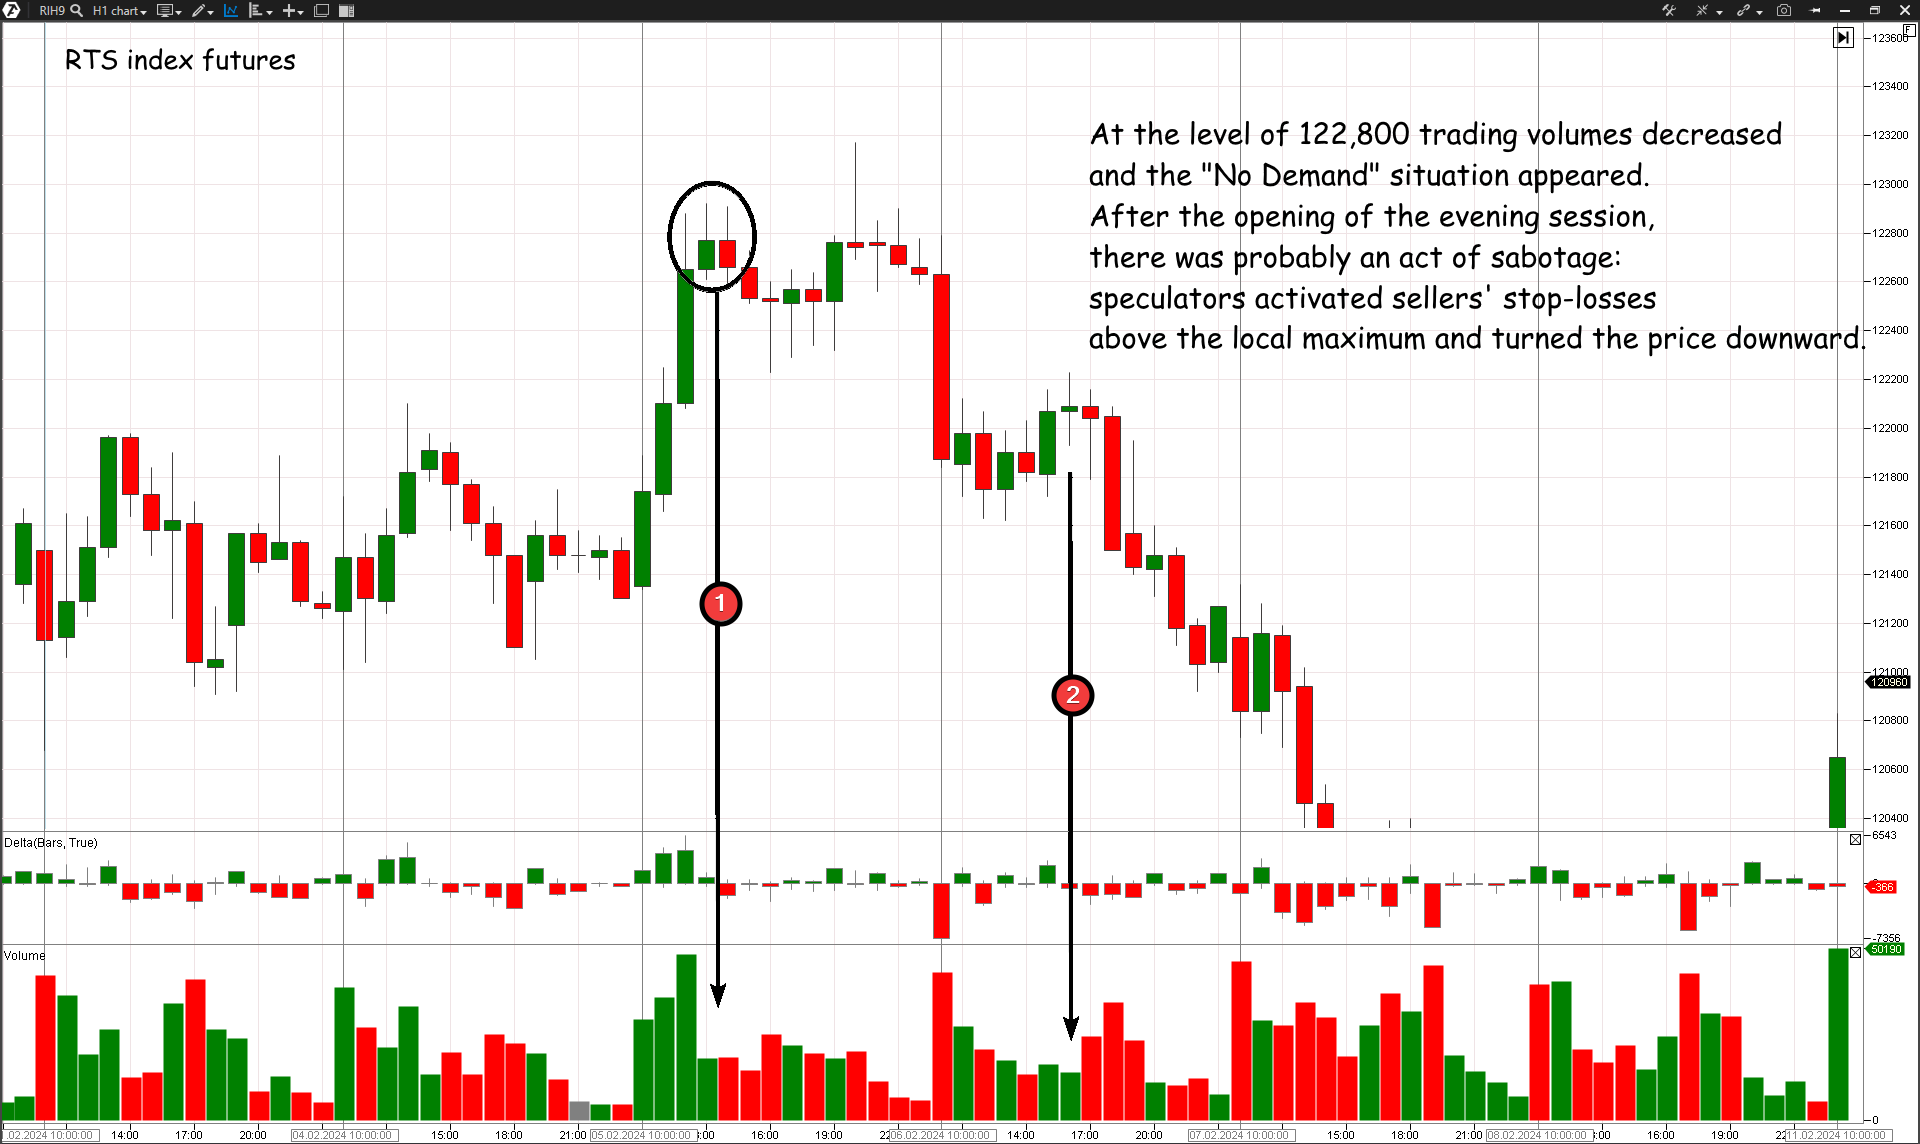
Example of market situation "No demand"
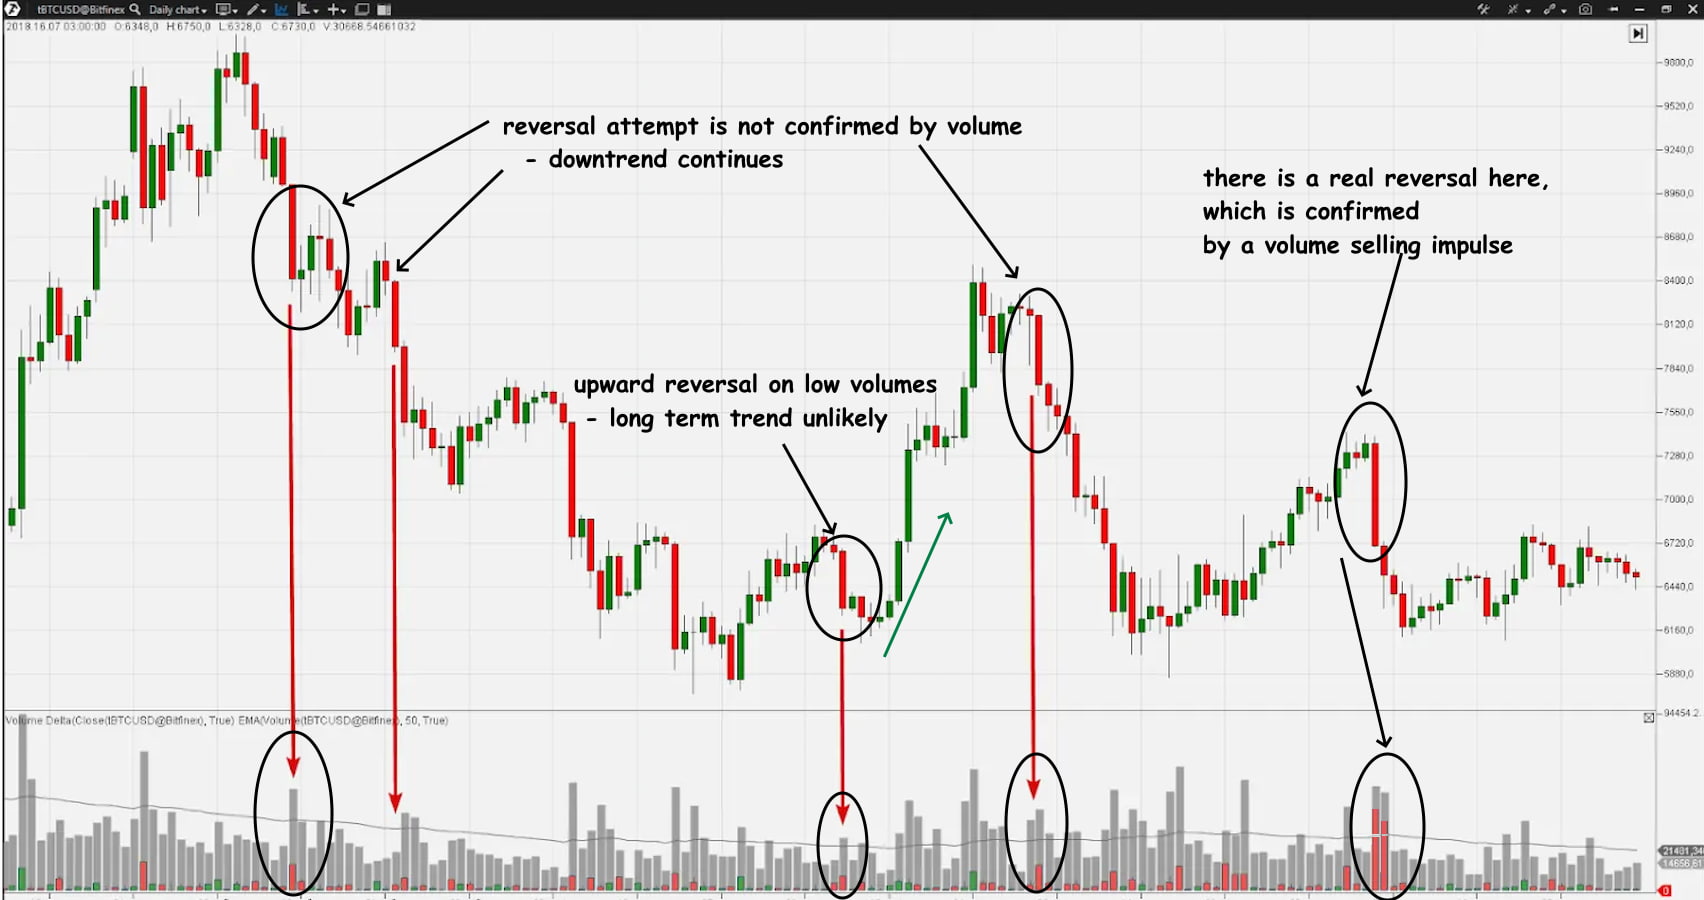
Climax Reversal Strategy
Identify buying or selling climaxes to catch trend reversals. Use additional indicators to confirm the reversal.
-
Buying/Selling Climaxes: High volume on a wide spread often signals the end of a trend and the start of a reversal.
Example: After a buying climax, wait for a bearish confirmation signal (e.g., a down bar with high volume) before entering a short position.
This suggests that the market may not continue to rise. This signals a potential buying opportunity. It indicates the end of a bullish trend and the beginning of a bearish phase.This signals the end of a bearish trend.
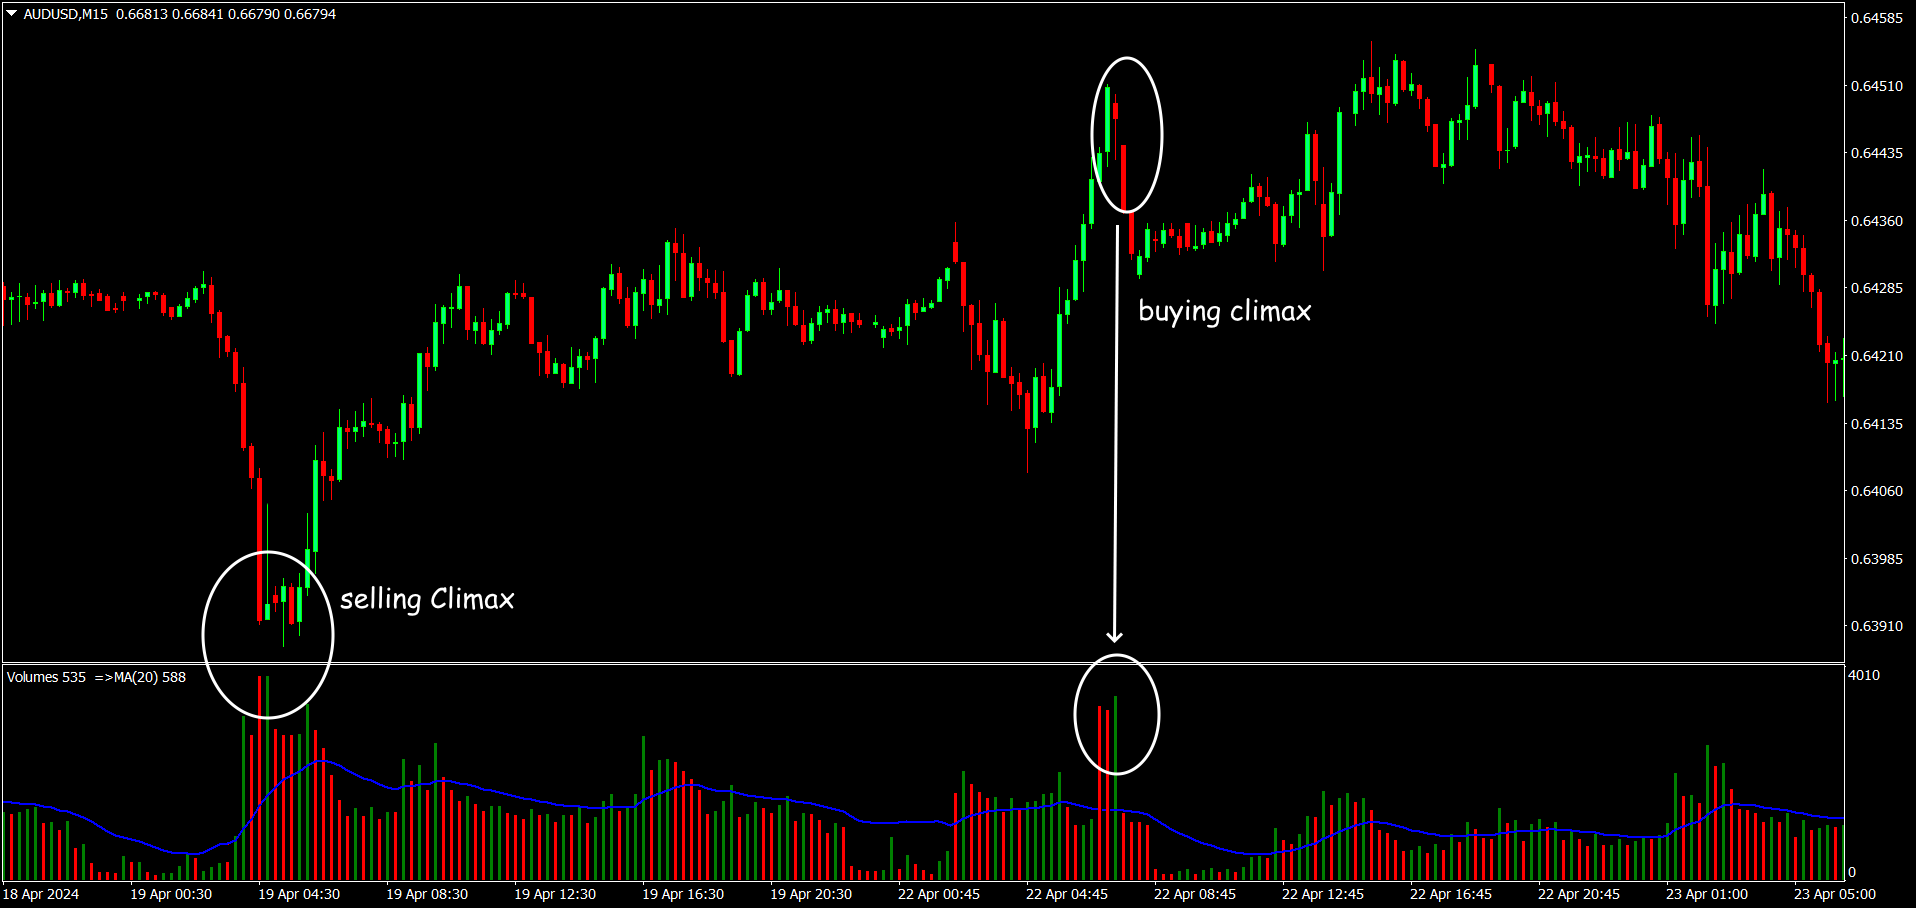
Example of a VSA reversal pattern
Breakout Confirmation
Use VSA to confirm breakouts from key levels of support or resistance. Ensure the breakout is accompanied by high volume for validation. Example: A breakout above resistance on high volume, followed by a low volume test of the new support level, can be a strong buy signal.
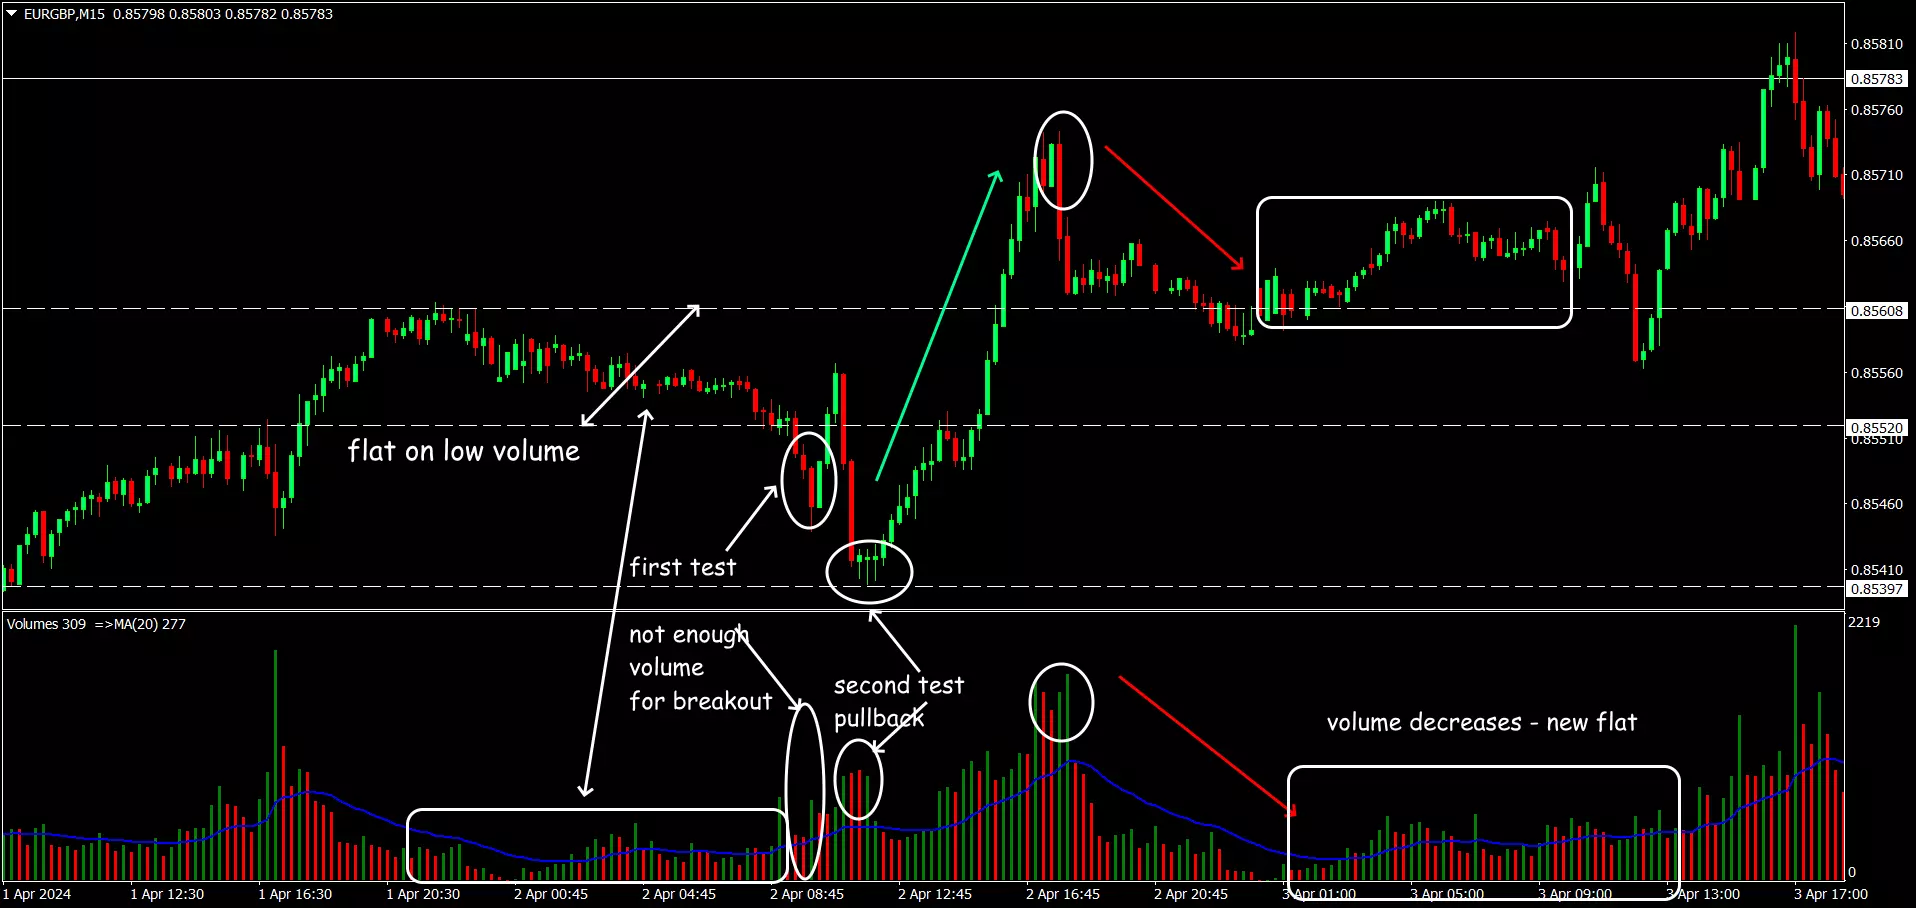
Example of VSA pattern for range breakout
Upthrusts and Springs
Springs are the opposite, where prices dip below support but then rise, signaling bullish pressure. False breakouts or breakdowns that indicate potential reversals.
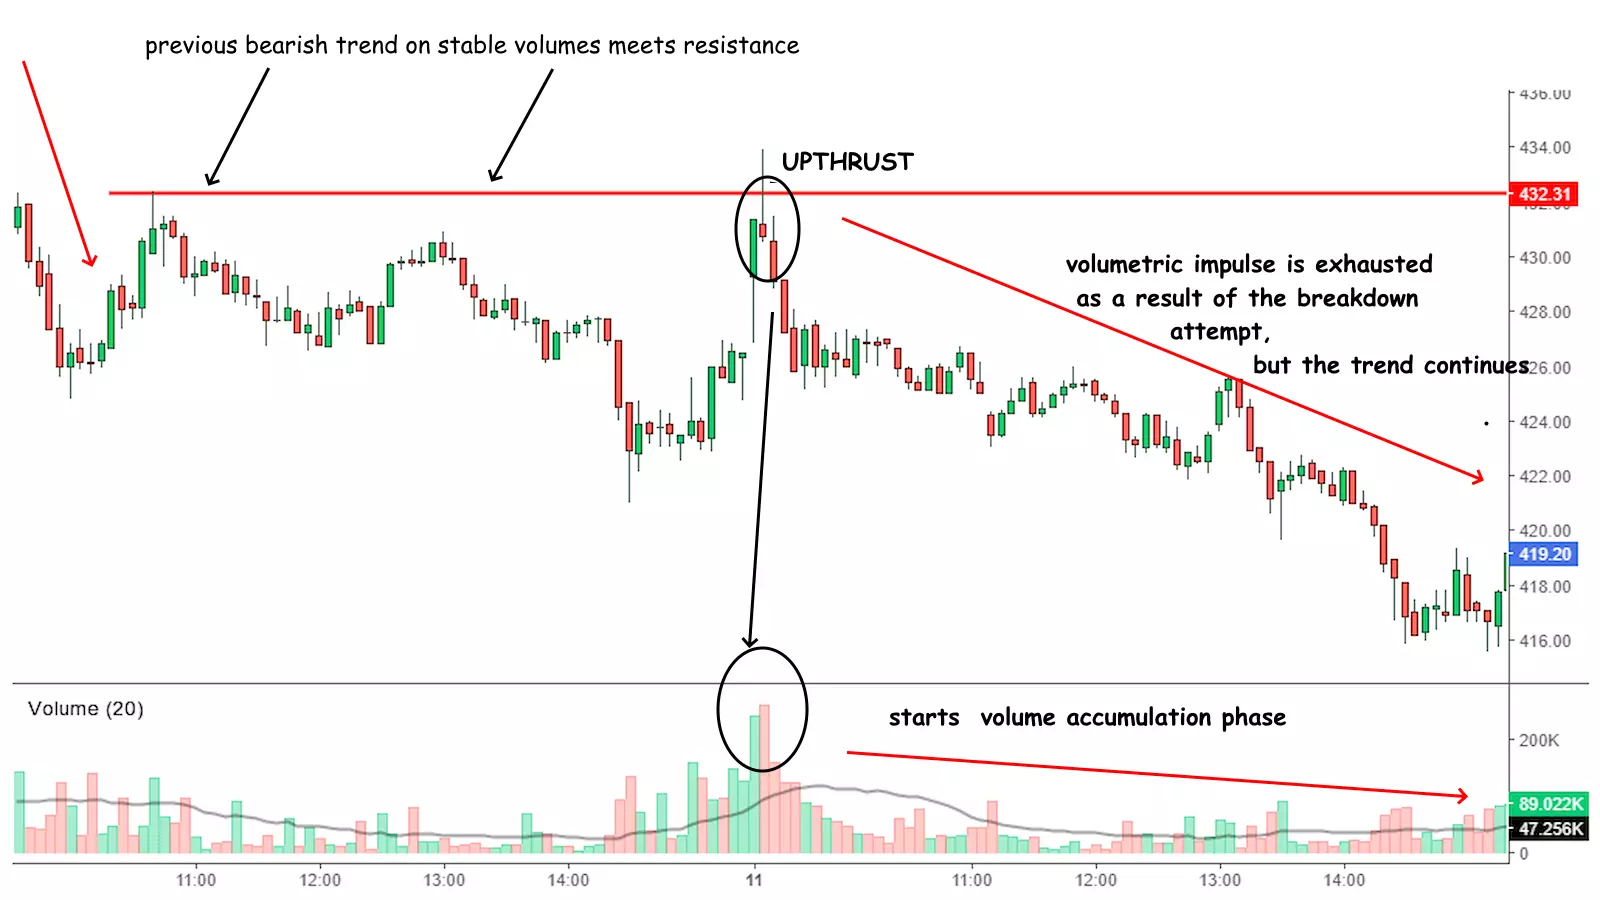
Example of VSA situation Upthrusts and Springs
Tests for Supply and Demand
A successful test indicates the absence of selling or buying pressure, confirming the trend.
VSA:Tests for Supply and Demand
Combining VSA with Other Technical Indicators
Integrating VSA with indicators like Moving Averages, RSI, and MACD can enhance trading strategies, can enhance the accuracy of trading signals. This helps in filtering out false signals and increasing the reliability of trades. For example, combining VSA signals with RSI overbought/oversold levels can improve trade accuracy.
Example of VSA logic in a complex strategy
Evaluate Your Trading Style:
-
Day Trading: If you prefer short-term trades, focus on VSA patterns that appear on intraday charts (e.g., 5-minute or 15-minute charts).
-
Swing Trading: For holding positions for several days, use VSA patterns on daily or 4-hour charts.
-
Long-Term Investing: Use weekly or monthly charts to apply VSA for long-term investment decisions.
-
Backtest Your Strategy. Backtest your VSA strategies using historical data to evaluate their effectiveness. Look for consistency and profitability over different market conditions.
-
Optimize your strategy by adjusting parameters like the volume threshold for no demand/supply bars or the spread width for climaxes.
Tips for Beginners
-
Beginners should focus on understanding the basics of VSA before live trading. This includes learning key patterns, interpreting volume data, and practicing with demo accounts.
-
Books by market gurus such as Tom Williams and Richard Wyckoff can be considered an volume spread analysis cheat sheet.
-
Traders need reliable trading platforms with VSA capabilities, good charting software, and data feeds. Costs may include software subscriptions and hardware for efficient trading.
Tips for Advanced Traders
-
Advanced traders can explore sophisticated VSA techniques, such as combining multiple VSA patterns and integrating VSA with high-frequency trading algorithms.
-
Optimizing VSA strategies involves backtesting, adjusting parameters, and using statistical analysis to improve performance.
-
Ongoing market research is crucial for adapting VSA strategies. Analyzing market trends, news, and economic indicators helps traders stay ahead.
What are the advantages of using VSA in trading?
VSA offers several advantages to traders by providing deeper insights into market dynamics and enhancing trading strategies.
-
Identifying Market Moves Driven by Professional Traders
-
Enhanced Market Timing
-
Confirmation of Trends and Reversals
-
Detecting Market Manipulation
-
Versatility Across Markets and Timeframes
-
Combining with Other Technical Indicators
-
Improved Risk Management
-
Understanding Market Sentiment
Risks and Warnings
Trading Risks
VSA trading involves risks such as market volatility, misinterpretation of signals, and technical errors.
Illiquid or speculative market
VSA works best in markets with high liquidity and reliable volume data. It may not be as effective in markets with low liquidity or irregular volume patterns, such as certain cryptocurrency markets or small-cap stocks.
False Signals
Combine VSA with other technical analysis tools and indicators. Backtest your strategies to evaluate their historical performance.
Emotional and Psychological Factors
Develop a solid trading plan that includes entry and exit rules based on VSA signals. Use risk management techniques, such as setting stop-loss orders and position sizing, to control potential losses.
External Market Risks
Stay informed about global economic and political developments that could affect the markets. Incorporate fundamental analysis alongside VSA.
Expert Opinion
Both candlestick patterns and VSA can help in setting more accurate stop-loss and take-profit levels, enhancing risk management.
VSA trading strategies have proven effective for many traders by providing deep insights into market dynamics through the relationship between volume and price. Here are key points outlining their effectiveness:
-
Understanding Market Sentiment and Professional Activity
-
Enhanced Accuracy in Predicting Trends and Reversals
-
Applicability Across Markets and Timeframes
-
Combining VSA with Other Technical Indicators
While VSA offers powerful insights and can be highly beneficial for traders, its complexity and steep learning curve may pose challenges for beginners. However, with dedicated study, practice, and a cautious approach, beginners can gradually incorporate VSA into their trading strategies. It is essential to balance VSA with simpler techniques and robust risk management to enhance trading success while minimizing risks.

Conclusion
VSA trading strategies are effective in providing deeper insights into market dynamics, predicting trends and reversals, and improving risk management.
Keep in mind that VSA:
-
provides valuable confirmation of trends and reversals, increasing the accuracy of trading decisions;
-
can be applied to a variety of markets and timeframes, making it a versatile tool for a variety of trading strategies;
-
requires a deep understanding and experience to accurately interpret the signals, and it may not always be understood by novices.
Their versatility across different markets and timeframes, combined with the ability to synergize with other technical indicators, makes VSA a powerful tool for traders. However, the effectiveness of VSA depends on the trader's ability to correctly interpret signals and integrate them into a comprehensive trading strategy. Remember that no trading method is foolproof, and continuous learning and adaptation are key to long-term success.
FAQs
What is VSA?
VSA (Volume Spread Analysis) is a technical analysis method that uses trading volume and spread (the difference between the high and low of a price bar) information to assess market sentiment and predict its future movements. VSA originated in the stock markets in the first half of the 20th century. One of the pioneers of VSA analysis was Richard Wyckoff, and his ideas were developed by Tom Williams into the system that is used today.
Is VSA a Good Method for Beginners?
VSA (Volume Spread Analysis) is a complex method that requires a deep understanding of the market and trading psychology. It demands strict discipline and adherence to signals. You must be prepared to go against the crowd and make trades that may seem illogical to traditional traders. VSA should be combined with other technical and fundamental analysis methods. However, the profits from correct VSA trades can justify the effort.
What Assets Can Be Traded with VSA?
VSA can be used to trade any assets for which volume and spread data are available, The optimal VSA assets are stocks and futures, as full exchange information is available for them.
VSAs can be used to trade forex, although this can be more complicated due to the decentralized structure of this market. VSA on cryptocurrencies is considered a less profitable method of trading.
How to use VSA with other technical indicators?
VSA can be effectively combined with various technical tools, but only with those that complement rather than contradict the logic of the method. For example, volume indicators (On-Balance Volume), Accumulation/Distribution Index (A/D), Volume Weighted Average Price (VWAP).Regular moving averages and volatility indicators are also useful.
Glossary for novice traders
-
1
Backtesting
Backtesting is the process of testing a trading strategy on historical data. It allows you to evaluate the strategy's performance in the past and identify its potential risks and benefits.
-
2
Fundamental Analysis
Fundamental analysis is a method or tool that investors use that seeks to determine the intrinsic value of a security by examining economic and financial factors. It considers macroeconomic factors such as the state of the economy and industry conditions.
-
3
Take-Profit
Take-Profit order is a type of trading order that instructs a broker to close a position once the market reaches a specified profit level.
-
4
Forex Trading
Forex trading, short for foreign exchange trading, is the practice of buying and selling currencies in the global foreign exchange market with the aim of profiting from fluctuations in exchange rates. Traders speculate on whether one currency will rise or fall in value relative to another currency and make trading decisions accordingly. However, beware that trading carries risks, and you can lose your whole capital.
-
5
Volatility
Volatility refers to the degree of variation or fluctuation in the price or value of a financial asset, such as stocks, bonds, or cryptocurrencies, over a period of time. Higher volatility indicates that an asset's price is experiencing more significant and rapid price swings, while lower volatility suggests relatively stable and gradual price movements.

Team that worked on the article

Andrey Mastykin is an experienced author, editor, and content strategist who has been with Traders Union since 2020. As an editor, he is meticulous about fact-checking and ensuring the accuracy of all information published on the Traders Union platform. Andrey focuses on educating readers about the potential rewards and risks involved in trading financial markets.
He firmly believes that passive investing is a more suitable strategy for most individuals. Andrey's conservative approach and focus on risk management resonate with many readers, making him a trusted source of financial information.

Dr. BJ Johnson is a PhD in English Language and an editor with over 15 years of experience. He earned his degree in English Language in the U.S and the UK. In 2020, Dr. Johnson joined the Traders Union team. Since then, he has created over 100 exclusive articles and edited over 300 articles of other authors.

Mirjan Hipolito is a journalist and news editor at Traders Union. She is an expert crypto writer with five years of experience in the financial markets. Her specialties are daily market news, price predictions, and Initial Coin Offerings (ICO).