Ethereum Crash Explained


Editorial Note: While we adhere to strict Editorial Integrity, this post may contain references to products from our partners. Here's an explanation for How We Make Money. None of the data and information on this webpage constitutes investment advice according to our Disclaimer.
Ethereum’s price declines typically reflect a mix of macroeconomic pressure, shifting risk sentiment, and technical breakdowns rather than a single isolated trigger. Periods of tighter liquidity, reduced institutional participation, or broad profit-taking after strong rallies can weigh on ETH. When key support levels break, leveraged positions may be liquidated, accelerating downside momentum. Whether the move deepens or stabilizes usually depends on broader market conditions, capital flows, and overall network activity.
Ethereum remains the second-largest cryptocurrency by market capitalization and a core pillar of decentralised finance and Web3 infrastructure. However, entering 2026, ETH price action has weakened noticeably compared to the optimism seen in late 2024 and mid-2025. After struggling to hold the psychological $3,000 level, Ethereum has shown renewed downside pressure amid broader crypto market volatility.
This pullback has raised questions among traders about whether Ethereum is experiencing a deeper structural shift or a corrective phase within a longer-term trend. With ETH testing key technical supports and global risk sentiment remaining fragile, understanding the causes of the decline is essential for evaluating what may come next. This article breaks down the macroeconomic, technical, and network-specific factors behind Ethereum’s recent crash and outlines the scenarios traders should monitor going forward.
Risk warning: Cryptocurrency markets are highly volatile, with sharp price swings and regulatory uncertainties. Research indicates that 75-90% of traders face losses. Only invest discretionary funds and consult an experienced financial advisor.
Why is Ethereum (ETH) down?
Ethereum (ETH) typically declines due to a mix of macroeconomic pressure, reduced market liquidity, and shifts in investor sentiment rather than a single isolated cause. When global risk appetite weakens – for example, during periods of tighter monetary policy or equity market stress – capital often flows out of higher-volatility assets like crypto.
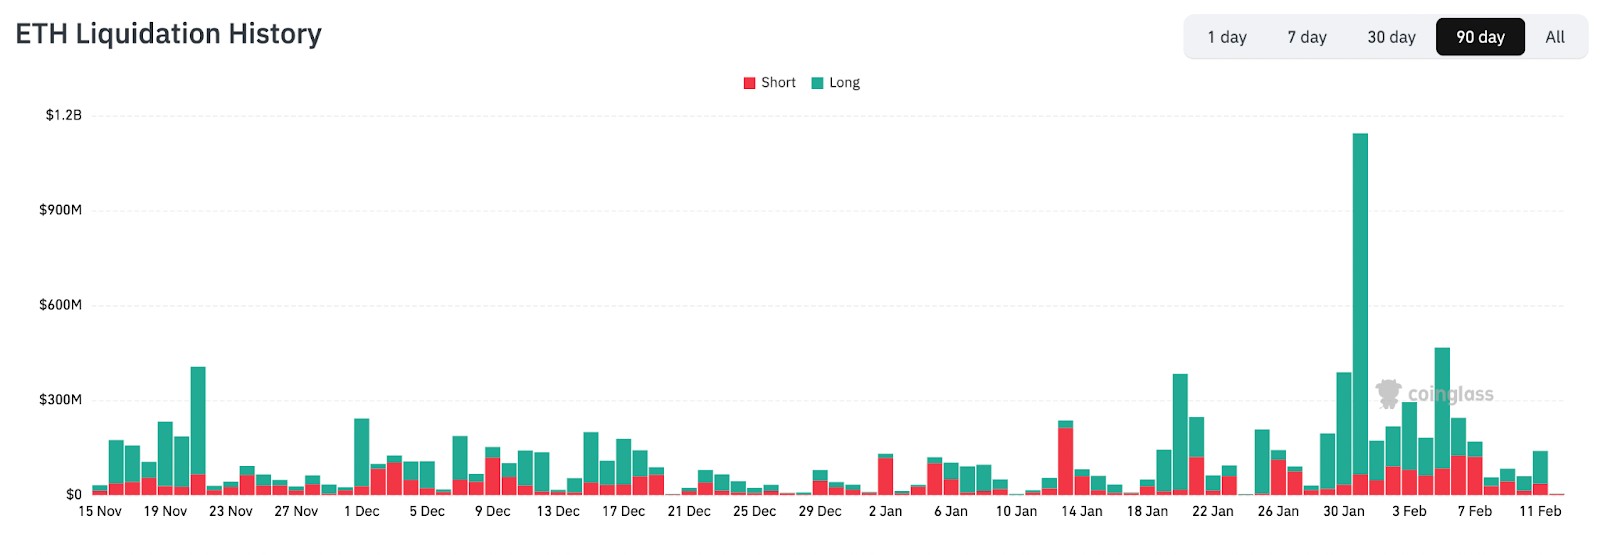
In addition, technical breakdowns below key support levels can accelerate selling. When ETH drops under important price zones, leveraged long positions may be liquidated automatically, triggering cascades of forced selling. This chain reaction can amplify short-term volatility and deepen declines.
Network-specific factors may also contribute. Slower on-chain activity, reduced DeFi participation, lower staking inflows, or declining transaction volumes can weaken investor confidence. At the same time, profit-taking after strong rallies often leads to corrective phases.
In most cases, Ethereum’s pullbacks reflect broader crypto market cycles, liquidity conditions, and leverage dynamics rather than structural weakness in the protocol itself.

The macroeconomic environment in 2026
Global liquidity conditions and risk sentiment
Ethereum, like most risk assets, is highly sensitive to global liquidity and investor risk appetite. In 2026, tighter financial conditions and cautious capital allocation have limited inflows into speculative markets, including cryptocurrencies. Reduced liquidity tends to amplify downside moves, as fewer buyers step in when prices fall.
When investors prioritise capital preservation, exposure to volatile assets such as ETH is often reduced first. This shift has contributed to weaker demand during sell-offs and slower recoveries after rebounds.
Correlation with traditional markets
Ethereum’s correlation with traditional risk assets has remained elevated. Periods of stress in equity markets or shifts toward safe-haven assets such as government bonds and gold often coincide with pressure on ETH prices. In early 2026, this pattern has been visible as capital rotated away from growth-oriented assets amid economic uncertainty.
These macro forces shape sentiment, leverage, and liquidity across markets. As a result, Ethereum’s price action reflects not only crypto-specific developments but also broader trends in global financial markets.
Ethereum online chart
Market psychology and liquidation events
Cascades of forced selling
One of the strongest accelerators of Ethereum price declines is forced selling triggered by liquidations. When ETH breaks below key technical levels, leveraged positions can be closed automatically by exchanges. This often creates a chain reaction, where sell orders push prices lower, triggering further liquidations in rapid succession.
Although large-scale liquidation events have become less frequent compared to earlier market cycles, leverage remains a structural risk in crypto markets. During periods of low liquidity, even moderate price moves can escalate into sharp declines.
Profit-taking and position rotation
Market psychology also plays a major role during downturns. After strong rallies in previous periods, many traders lock in profits when uncertainty rises. In 2026, elevated macro risks have encouraged investors to rotate capital away from volatile assets like ETH and toward perceived safer alternatives.
This behaviour does not necessarily reflect a loss of confidence in Ethereum’s long-term value. Instead, it highlights how sentiment and positioning can drive short-term price weakness, especially when traders reduce exposure ahead of economic data releases or geopolitical events.
Technical chart patterns driving downside
Technical analysis has played a key role in shaping Ethereum’s downside moves in 2026. As price action weakened, several widely watched chart levels and patterns contributed to increased selling pressure and cautious trader behaviour.
ETH has spent extended periods testing the $2,900 to $3,200 zone, a critical support area that many traders use to define market structure. Failure to hold this range has often led to additional sell orders, as stop-loss levels are triggered and short positions gain momentum. Once support breaks, price commonly revisits lower reference points where buyers previously stepped in.
Short-term chart formations have also reflected seller control. Descending channels and continuation patterns suggest that rallies are being sold rather than extended. Until Ethereum can reclaim and hold key resistance levels with strong volume, technical signals continue to favour caution. For traders, these patterns provide clear reference points for managing risk, defining invalidation levels, and avoiding entries against the prevailing trend.
Microeconomic and network-specific pressures
Decentralised Finance (DeFi) and network usage
Ethereum’s long-term value is closely tied to activity across decentralised finance and smart contract usage. Metrics such as transaction volume, active addresses, and Total Value Locked help indicate whether network demand is strengthening or weakening. In periods where these indicators stagnate or decline, ETH loses a layer of fundamental support, making price more vulnerable during broader market pullbacks.
Slower growth in on-chain activity does not necessarily signal structural failure, but it can limit recovery speed after sharp declines. Traders often look for stabilisation or improvement in these metrics as confirmation that selling pressure is easing.
Competition from rival Layer-1 networks
While Ethereum remains the dominant smart contract platform by ecosystem depth, competition has intensified. Faster or lower-cost networks continue to attract specific use cases, developers, and speculative capital. During risk-off phases, this competition can amplify capital rotation away from ETH.
Although Ethereum’s network effects remain strong, sustained competitive pressure can influence short- and medium-term price discovery, especially when overall liquidity is constrained.
Institutional adoption and ETF Inflows
Institutional participation plays an increasing role in ETH price behaviour. Spot ETF flows, custody products, and tokenisation initiatives can support demand, but inconsistent inflows or periods of net outflows tend to weigh on sentiment. In 2026, mixed institutional positioning has contributed to uncertainty, reinforcing cautious trading behaviour rather than aggressive accumulation.
On-chain metrics in 2026
On-chain data provides real-time insight into Ethereum’s underlying health and helps traders distinguish between temporary price shocks and deeper structural weakness. In 2026, these metrics have become increasingly important as price action alone often reflects short-term positioning rather than fundamental shifts.
Active addresses and transaction counts. Changes in these metrics indicate whether user engagement is expanding or contracting. Sustained declines usually signal reduced demand, while stabilisation can precede price consolidation.
Staking participation. The amount of ETH locked in staking affects circulating supply. Higher participation can reduce sell pressure, while stagnation may leave more ETH available on the market.
Layer-2 activity. Growth on scaling networks reflects broader ecosystem usage even when mainnet activity slows. Strong Layer-2 adoption can support long-term demand for Ethereum despite near-term price weakness.
When combined with price trends and volume, on-chain indicators help traders evaluate whether selling pressure is driven by panic and leverage or by a genuine deterioration in network fundamentals.
Will Ethereum (ETH) go back up? Ethereum price predictions
Ethereum’s recovery potential depends on market structure, liquidity conditions, and investor sentiment. While short-term volatility can remain high, long-term trends are usually driven by adoption, network upgrades, and broader crypto market cycles. To better assess possible scenarios, our analysts have prepared forecasts for different time horizons.
Short-term outlook for Ethereum
In the short term, ETH price movements are typically influenced by technical levels, derivatives positioning, and macro news. Breaks above resistance or below support zones often trigger accelerated moves due to liquidations and momentum trading.
The table below reflects our analysts’ short-term expectations, including projected ranges and key technical levels that may define near-term direction.
| Month | Minimum Price, $ | Average Price, $ | Maximum Price, $ |
|---|---|---|---|
| August 2026 | 1800 | 1800 | 1900 |
| September 2026 | 2500 | 2600 | 2695 |
| October 2026 | 3100 | 3200 | 3200 |
| November 2026 | 3100 | 3200 | 3200 |
| December 2026 | 2800 | 2800 | 2900 |
Short-term projections should be viewed as tactical scenarios rather than guarantees, as crypto markets can react quickly to external shocks or sudden capital inflows.
Long-term forecast for Ethereum
Over a longer horizon, Ethereum’s trajectory is more closely tied to ecosystem growth, institutional interest, staking participation, and overall crypto adoption. Structural factors tend to outweigh temporary volatility when evaluating multi-year potential.
The following table outlines our analysts’ long-term Ethereum outlook, presenting estimated price ranges based on broader market cycle assumptions and fundamental development trends.
| Year | Price in the middle of the year | Price at the end of the year |
|---|---|---|
| 2026 | $1500 | $1600 |
| 2027 | $1600 | $2700 |
| 2028 | $2400 | $2400 |
| 2029 | $1800 | $1500 |
| 2030 | $1400 | $2500 |
| 2031 | $2400 | $4200 |
| 2032 | $5700 | $5400 |
| 2033 | $5081 | $3900 |
| 2034 | $3900 | $3200 |
| 2035 | $2594 | $2900 |
| 2036 | $3300 | $3000 |
| 2037 | $2300 | $3300 |
| 2038 | $2600 | $2800 |
| 2039 | $2700 | $4600 |
| 2040 | $4100 | $4100 |
Best place to buy Ethereum (ETH)
Ethereum is one of the most widely supported cryptocurrencies and can be purchased on most major crypto exchanges. Traders usually choose platforms based on liquidity, fees, security standards, and available trading tools.
When selecting where to buy ETH, it is important to consider whether the platform supports spot trading only or also offers advanced features such as derivatives, staking, or recurring purchases. Regulatory compliance and transparent fee structures are also key factors, especially during volatile market conditions.
Many traders prefer to store ETH in personal wallets after purchase to retain full control over their assets, while active traders may keep funds on exchanges for faster execution.
| Coinbase | OKX | Crypto.com | Kraken | Cryptohopper | |
|---|---|---|---|---|---|
|
Min. Deposit, $ |
10 | 10 | 1 | 10 | No |
|
Coins Supported |
249 | 329 | 250 | 278 | 1000 |
|
Spot Taker fee, % |
0.5 | 0.1 | 0.5 | 0.4 | 0 |
|
Spot Maker Fee, % |
0.5 | 0.08 | 0.25 | 0.25 | 0 |
|
Alerts |
Yes | Yes | Yes | Yes | Yes |
|
Copy trading |
No | Yes | No | Yes | Yes |
|
TU overall score |
8.6 | 8.48 | 8.44 | 8.32 | 7.85 |
|
Open an account |
Go to broker Your capital is at risk. |
Go to broker Your capital is at risk. |
Go to broker Your capital is at risk. |
Go to broker Your capital is at risk. |
Go to broker Your capital is at risk. |
Price prediction methodology
The following tools and instruments were used for making the prediction:
Basic instruments of technical analysis. The forecast relies on basic technical indicators. The analysis was performed mostly on medium and long-term time frames for more accurate results.
Statistical tools that allow experts to evaluate the probability of an event that may influence the prices of cryptocurrencies.
Individual features of a cryptocurrency startup and its competitiveness: number of tokens in free circulation, restriction of emission, potential usefulness of the startup for the society, roadmap and development plans of the startup, potential vulnerability of the startup’s blockchain, examples of hacks, failures in the entire history of cryptocurrency existence, capitalization dynamics compared to key competitors, share of major coin holders and other subjective factors.
Note:
This price prediction is based on current information and historical data. Strong fundamental factors capable of radically changing the overall situation in the cryptocurrency markets, impacting the prices of certain cryptocurrencies and subsequently changing the price trend, may appear in the future. The price predictions are updated regularly based on the latest data.
This article is created for informational purposes only and does not constitute investment advice. Be aware of the high volatility of cryptocurrencies and consider these risks when making investment decisions.
Latest Ethereum (ETH) News

Ethereum price forecast: Breakout attempt at $1,925 resistance

ETH selloff slows as oversold conditions limit further selling

Ethereum ETF demand clashes with weakening price momentum

ETH selloff as $1,857 support comes under pressure

SEC settles Coinbase records lawsuit over missing Gensler texts

Ethereum faces pullback risk despite rising ETF inflows
Structure first, prediction second

From a trading perspective, Ethereum downturns tend to reward structure and patience rather than aggressive prediction. During drawdowns, I advise traders to define risk first and treat price levels as areas of probability, not certainty. Position sizing should always be based on invalidation levels, not on how attractive a rebound may look. Protecting capital during unstable phases is what allows traders to participate fully when conditions improve.
Another important factor is context. Ethereum no longer trades in isolation. Its price is increasingly influenced by liquidity conditions, ETF flows, and broader market sentiment. I recommend waiting for signs of stabilisation, such as reduced selling pressure or improving on-chain activity, before increasing exposure. Over time, a disciplined approach helps reduce emotional decisions and leads to more consistent outcomes in high-volatility environments.
Conclusion
Ultimately, the Ethereum crash serves as a stark reminder of how swiftly sentiment can turn in volatile crypto markets, especially when amplified by broader macroeconomic shifts and technical breakdowns. Traders who ignore these warning signs risk significant losses, as seen in previous pullbacks triggered by regulatory uncertainty or sudden selloffs in the wider digital asset space. The crucial lesson is to stay vigilant, monitor key support levels, and align investment strategies with both fundamental and technical factors. In an environment as dynamic as crypto, adaptability is not just beneficial but essential to surviving — and even thriving — in the face of inevitable market downturns.
FAQs
What technical chart patterns signal increased risk during an Ethereum crash?
How does reduced institutional participation impact Ethereum's price during downturns?
What are the implications of liquidity conditions for Ethereum’s market stability?
How should traders approach risk management during periods of Ethereum weakness?
Editors' Top Picks and Insights

Global fintech in 2026: Three trends that matter

From Jesus Christ to aliens: Polymarket's most absurd prediction markets

Hunting crypto owners: Why criminals have gone offline

BitMEX is shutting down: Why Trump could not save the exchange

Do governments need crypto workers?

Brent nears $100: Why oil prices are rising
Related Articles
Team that worked on the article
Aleksandra Chaikina has been a contributor to Traders Union since 2021. With over 15 years of experience in copywriting and more than 5 years focused on financial content, she specializes in producing detailed guides, analytics, and comparative reviews across various sectors, including cryptocurrencies, Forex, investment strategies, and financial technologies.
Dan Blystone began his trading career in 1998 as an arbitrage clerk on the floor of the Chicago Mercantile Exchange (CME). He later traded bond and Eurex futures at proprietary firms such as Altea Trading, gaining valuable experience in high-frequency trading and risk management.
Chinmay Soni is a financial analyst with more than 5 years of experience in working with stocks, Forex, derivatives, and other assets. As a founder of a boutique research firm and an active researcher, he covers various industries and fields, providing insights backed by statistical data.
CFD is a contract between an investor/trader and seller that demonstrates that the trader will need to pay the price difference between the current value of the asset and its value at the time of contract to the seller.
A long position in Forex, represents a positive outlook on the future value of a currency pair. When a trader assumes a long position, they are essentially placing a bet that the base currency in the pair will appreciate in value compared to the quote currency.
Risk management is a risk management model that involves controlling potential losses while maximizing profits. The main risk management tools are stop loss, take profit, calculation of position volume taking into account leverage and pip value.
Ethereum is a decentralized blockchain platform and cryptocurrency that was proposed by Vitalik Buterin in late 2013 and development began in early 2014. It was designed as a versatile platform for creating decentralized applications (DApps) and smart contracts.
Forex leverage is a tool enabling traders to control larger positions with a relatively small amount of capital, amplifying potential profits and losses based on the chosen leverage ratio.

-
 Afghanistan
-
 Albania
-
 Algeria
-
 Angola
-
 Argentina
-
 Armenia
-
 Australia
-
 Austria
-
 Azerbaijan
-
 Bahamas
-
 Bahrain
-
 Bangladesh
-
 Belarus
-
 Belgium
-
 Bolivia
-
 Botswana
-
 Brazil
-
 Brunei
-
 Bulgaria
-
 Cambodia
-
 Cameroon
-
 Canada
-
 Chile
Chile
-
 China
China
-
 Colombia
-
 Congo
Congo
-
 Costa Rica
-
 Cote d'Ivoire
-
 Croatia
-
 Cuba
Cuba
-
 Cyprus
-
 Czechia
-
 DR Congo
-
 Denmark
-
 Dominican Republic
-
 Ecuador
-
 Egypt
Egypt
-
 El Salvador
-
 Estonia
-
 Eswatini
-
 Ethiopia
-
 Finland
-
 France
-
 Georgia
-
 Germany
-
 Ghana
Ghana
-
 Greece
-
 Haiti
Haiti
-
 Hong Kong
-
 Hungary
-
 India
India
-
 Indonesia
-
 Iran, Islamic republic
-
 Iraq
Iraq
-
 Ireland
-
 Israel
-
 Italy
Italy
-
 Jamaica
-
 Japan
Japan
-
 Jordan
-
 Kazakhstan
-
 Kenya
Kenya
-
 Korea
Korea
-
 Kuwait
-
 Kyrgyzstan
-
 Laos
Laos
-
 Latvia
-
 Lebanon
-
 Lesotho
-
 Libya
Libya
-
 Lithuania
-
 Luxembourg
-
 Madagascar
-
 Malaysia
-
 Malta
Malta
-
 Mauritius
-
 Mexico
-
 Moldova
-
 Mongolia
-
 Montenegro
-
 Morocco
-
 Mozambique
-
 Myanmar
-
 Namibia
-
 Nepal
Nepal
-
 Netherlands
-
 New Zealand
-
 Nigeria
-
 North Macedonia
-
 Norway
-
 Oman
Oman
-
 Pakistan
-
 Palestine
-
 Panama
-
 Papua New Guinea
-
 Paraguay
-
 Peru
Peru
-
 Philippines
-
 Poland
-
 Portugal
-
 Puerto Rico
-
 Qatar
Qatar
-
 Reunion
-
 Romania
-
 Rwanda
-
 Saudi Arabia
-
 Serbia
-
 Singapore
-
 Slovakia
-
 Slovenia
-
 Somalia
-
 South Africa
-
 Spain
Spain
-
 Sri Lanka
-
 Sweden
-
 Switzerland
-
 Syria
Syria
-
 Taiwan
-
 Tajikistan
-
 Tanzania
-
 Thailand
-
 Trinidad and Tobago
-
 Tunisia
-
 Turkey
-
 UAE
UAE
-
 Uganda
-
 Ukraine
-
 United Kingdom
-
United States
-
 Uruguay
-
 Uzbekistan
-
 Venezuela
-
 Vietnam
-
 Yemen
Yemen
-
 Zambia
-
 Zimbabwe
- Forex
- Crypto
- Why is Ethereum (ETH) down?
- The macroeconomic environment
- Ethereum online chart
- Market psychology and liquidation events
- Technical chart patterns driving downside
- Microeconomic and network-specific pressures
- On-chain metrics
- Will Ethereum (ETH) go back up?
- Best place to buy Ethereum (ETH)
- Price prediction methodology
- Expert opinion
- Conclusion
- FAQs
