Best Price Action Techniques For Binary Trading
In order to use price action to trade binary options, one must develop a thorough understanding of various candlestick patterns, as well as their interaction with different technical indicators. Some renowned candlestick patterns include:
-
Bullish engulfing
-
Bearish engulfing
-
Morning star
-
Ascending triangle
-
Pin bar
Understanding and interpreting price movements can be the key differentiator between profitable and unprofitable trades. In this article, the experts at TU look at some of the best price action techniques for binary trading and delve into the process of reading charts, recognizing patterns, and understanding market sentiment.
-
How do you trade options with price action?
Trading options with price action involves analyzing recent and historical price movements to make informed decisions. Utilize price action indicators, identify patterns, and consider trend directions to enter or exit trades.
-
What is the best way to trade binary options?
The best way to trade binary options is by combining a sound strategy with effective risk management. Understand market trends, use technical analysis tools, and implement risk mitigation techniques to enhance the probability of successful trades.
-
What is the 5-minute binary strategy?
The 5-minute binary strategy involves making short-term trades based on price movements within a 5-minute time frame. Traders often use quick analysis, such as candlestick patterns and indicators, to capitalize on short-term market fluctuations.
-
How do you predict binary options trading?
Predicting binary options trading involves a comprehensive approach. Use technical analysis, fundamental analysis, and market indicators. Combine these with a thorough understanding of the chosen asset, market trends, and economic factors to make more informed predictions.
What is a price action strategy?
A price action strategy in binary options trading is a methodology that enables traders to analyze and interpret the market by closely observing recent and real price movements.
For instance, if a trader using a price action strategy observes a consistent upward movement in an asset's price, they may interpret this as a bullish trend. This observation becomes a crucial factor in their decision-making process, allowing for more nuanced and context-specific trading choices.
Best binary options brokers
Importance of price action strategies
Price action strategies hold significance in binary options trading due to their capacity to help traders make well-informed decisions based on real-time market conditions. Moreover, they facilitate straightforward backtesting of identified strategies on historical data, enhancing the trader's ability to refine and optimize their approach.
Consider a situation where a trader using a price action strategy notices a sudden increase in trading volume along with a sharp decline in the price of an asset. This observed price action could signal a potential trend reversal, prompting the trader to adjust their trading strategy accordingly.
Understanding price action trading
What is the role of price action in binary options trading?
In binary options trading, where the focus is on predicting price movements within a specified time frame, price action becomes a crucial tool for assessing the potential direction of the market. By examining recent price changes, traders can identify patterns that indicate the strength or weakness of a trend, potential reversals, or the likelihood of a continuation. This strategy is particularly valuable in binary options, where precision and timing are paramount.
Best price action candlesticks and patterns in binary trading
Bullish engulfing
This pattern signifies a shift in momentum from bearish to bullish. It occurs when a small bearish candle is followed by a larger bullish candle that completely engulfs the previous one. Traders interpret this as a potential upward reversal.
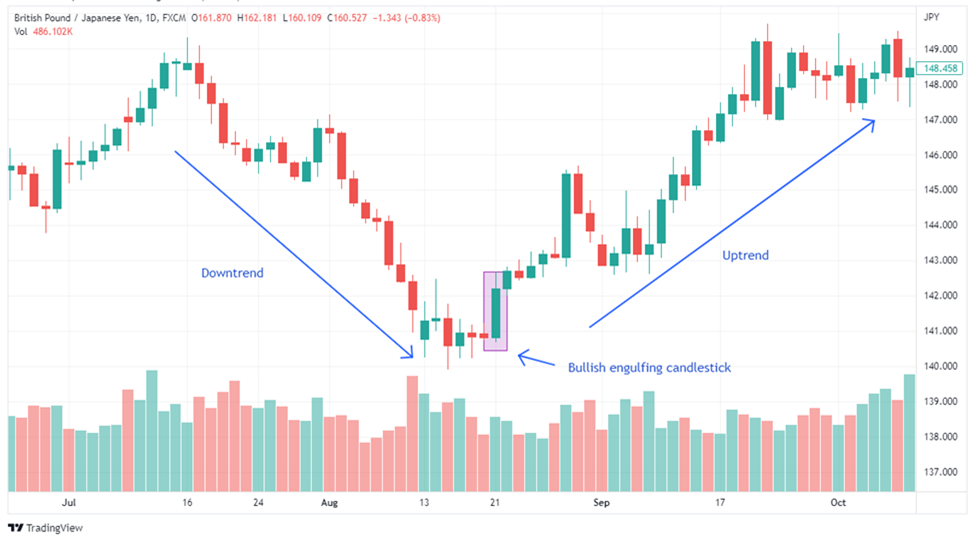
Bullish engulfing
Bearish engulfing
In contrast to the bullish engulfing pattern, the bearish engulfing pattern suggests a potential reversal from bullish to bearish. It occurs when a small bullish candle is followed by a larger bearish candle that engulfs the previous bullish candle.
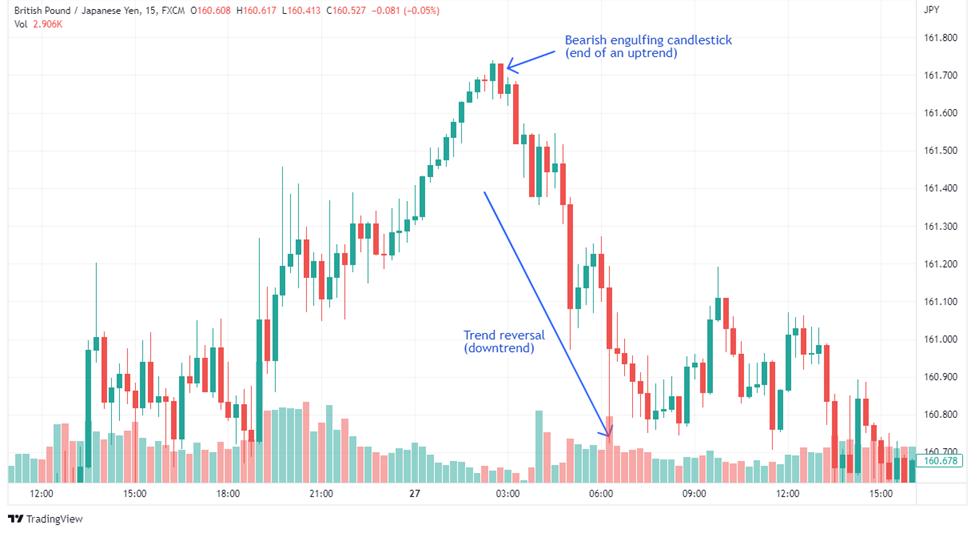
Bearish engulfing
Morning star
The morning star is a bullish reversal pattern that emerges after a downtrend. It consists of three candles – a long bearish candle, a small candle that gaps down, and a long bullish candle that gaps up. This pattern indicates a potential reversal of the downtrend.
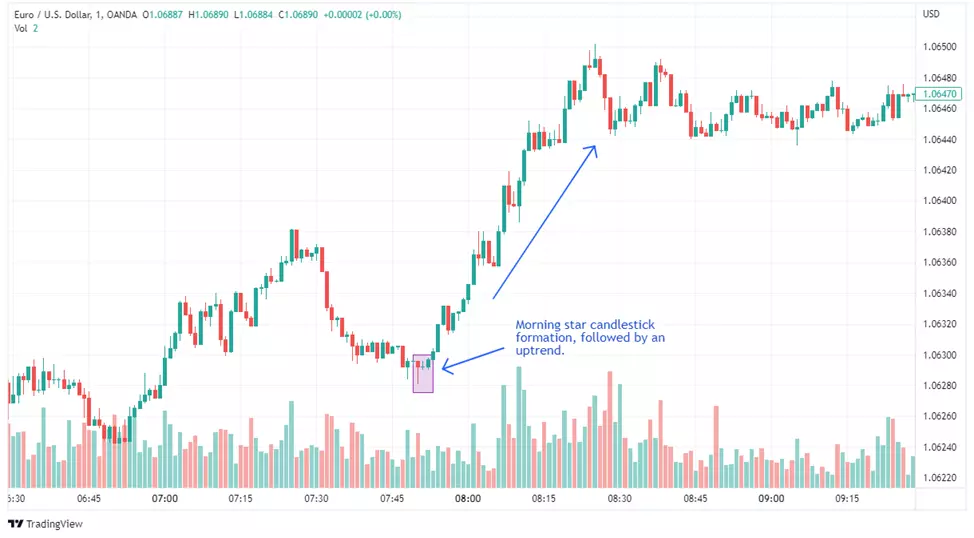
Morning star
Ascending triangle
The ascending triangle is a bullish continuation pattern. It forms when the price creates higher lows, testing a resistance level multiple times. Traders interpret this pattern as a potential signal for the continuation of an upward trend.
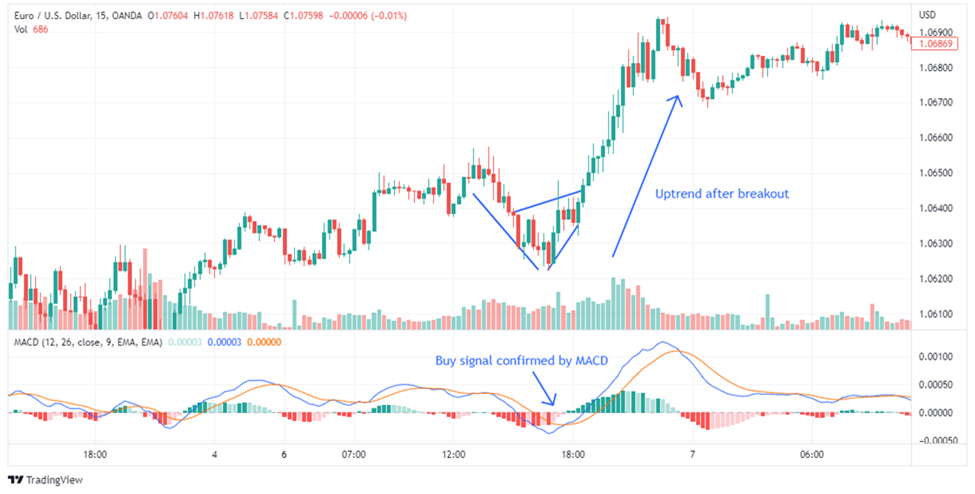
Ascending triangle
Descending triangle
The descending triangle is a bearish continuation pattern. It occurs when the price forms lower highs, testing a support level multiple times. Traders look at this pattern as a potential signal for the continuation of a downward trend.
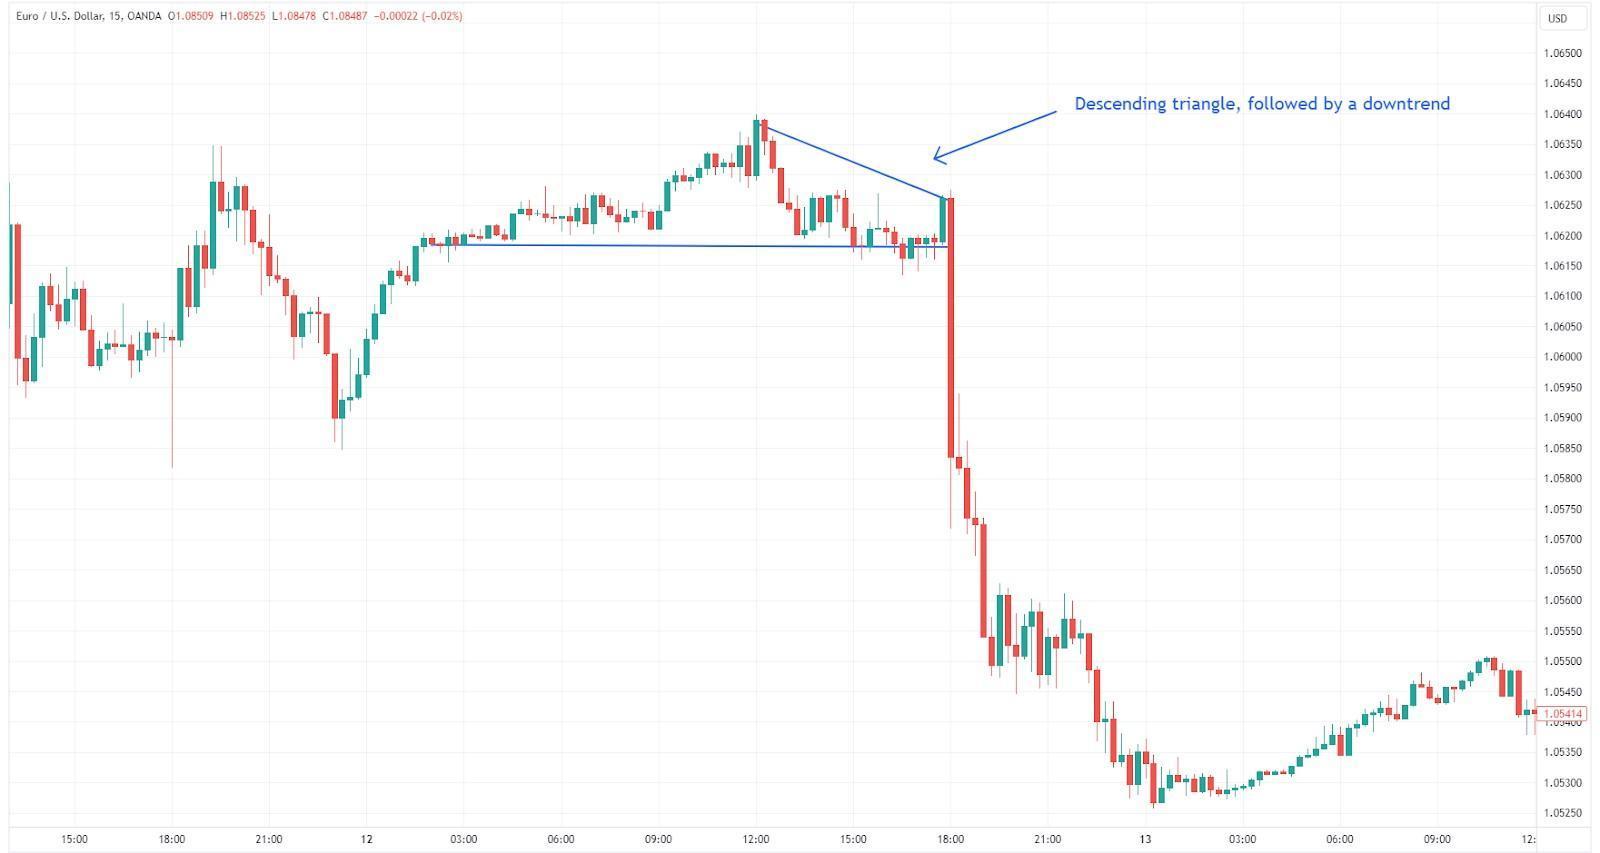
Descending triangle
Head and shoulders
The head and shoulders pattern is a bearish reversal formation. It typically occurs after an uptrend and consists of three peaks, with the middle peak being the highest. A neckline connects the lows between the peaks, suggesting a potential trend reversal.
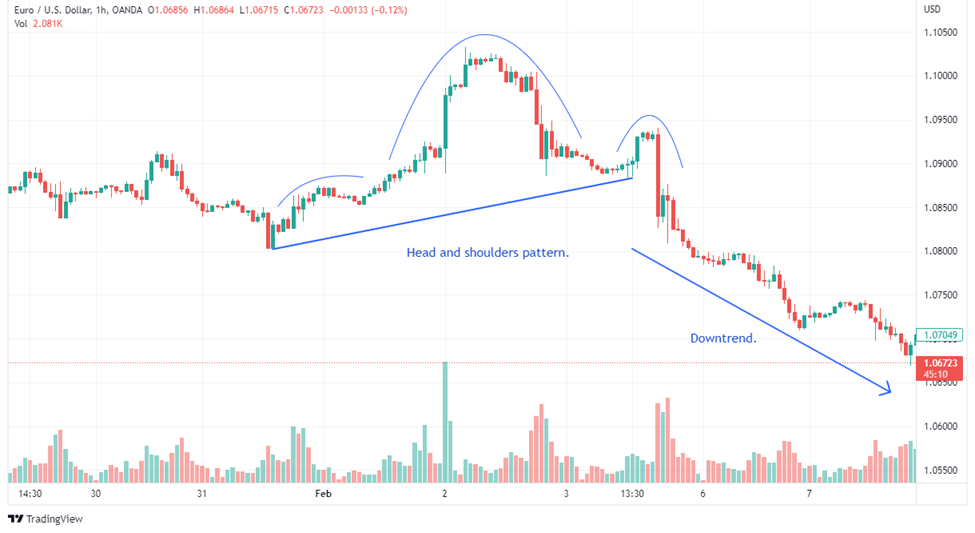
Head and shoulders
Pin bar
This strategy is based on identifying pin bars, which are candlesticks with a small body and a long wick. Pin bars can indicate a potential reversal in the market.
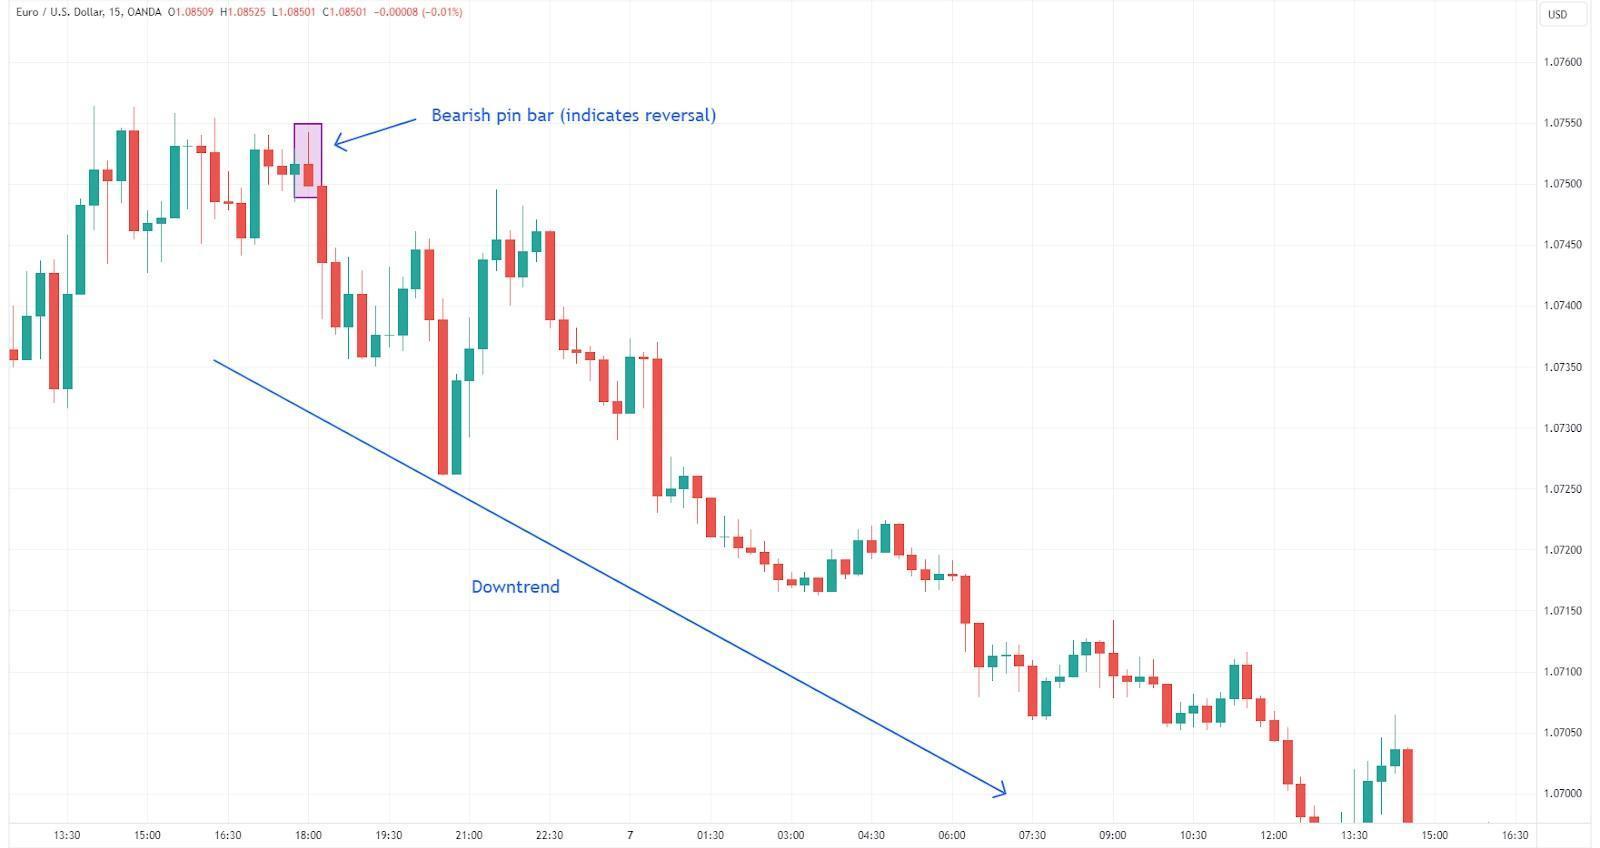
Pin bar
Inside bar
This strategy is based on identifying inside bars, which are candlesticks that are completely contained within the range of the previous candlestick. Inside bars can indicate a potential breakout or reversal in the market.
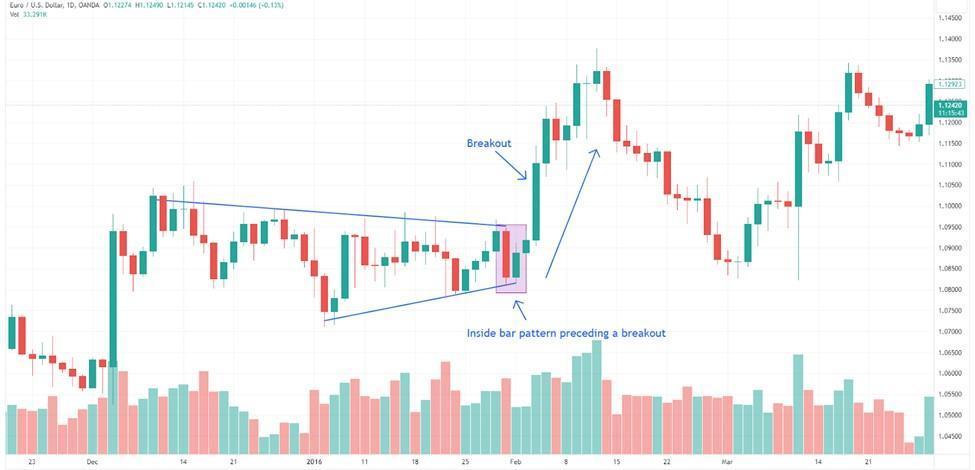
Inside bar
| Candlestick Pattern | Significance |
|---|---|
|
Bullish engulfing |
Indicates a potential reversal from a downtrend to an uptrend. It occurs when a bullish candle fully engulfs the previous bearish candle |
|
Bearish engulfing |
Suggests a potential reversal from an uptrend to a downtrend. It occurs when a bearish candle fully engulfs the preceding bullish candle |
|
Morning star |
Signals a potential bullish reversal. It consists of three candles - a long bearish candle, a small bullish or bearish gap, and a long bullish candle |
|
Ascending triangle |
A continuation pattern that suggests the potential continuation of an existing uptrend. It forms as higher lows converge towards a horizontal resistance line |
|
Descending triangle |
A continuation pattern indicating the potential continuation of a downtrend. It forms as lower highs converge towards a horizontal support line |
|
Head and shoulders |
A reversal pattern indicating a potential trend change. It consists of three peaks - a higher peak (head) between two lower peaks (shoulders) |
|
Pin bar |
Signifies a potential reversal in price direction. It has a small body and a long wick, indicating a rejection of higher or lower prices by the market |
|
Inside bar |
Represents a period of consolidation or indecision in the market. It occurs when the current candle's range is within the high and low of the previous candle |
What is the importance of price action confirmation?
Price action confirmation are critical aspects of utilizing price action strategies effectively in binary options trading. Confirmation for entering a Call or Put position involves using additional indicators to validate a trend suggested by one indicator. It acts as a risk mitigation strategy, ensuring that traders have a more comprehensive view before making trading decisions.
Confirmation signals are employed to substantiate various market signals, including breakouts, reversals, and continuations. They add a layer of assurance to the analysis, reducing the likelihood of false signals. However, traders must remain vigilant about confirmation bias – the tendency to give more weight to information that aligns with preconceived notions while dismissing conflicting data.
Despite the valuable role of confirmation signals, traders should acknowledge their imperfections. No single indicator or confirmation signal guarantees accuracy, and the dynamic nature of financial markets means that conditions can change rapidly. Therefore, traders should use confirmation signals in conjunction with their overall trading strategy and consider the various features and tools at their disposal.
The importance of price action confirmation lies in the recognition that past price action is not always an infallible predictor of future outcomes. Numerous factors can affect markets, and unexpected events can cause abrupt changes in direction. Traders employing price action strategies, coupled with other confirmation are better equipped to adapt to changing market conditions and make timely decisions to protect their capital.
Identifying price patterns with price action indicators
Price action indicators play a crucial role in aiding traders to identify and interpret price patterns in the market. These indicators, grounded in technical analysis, analyze the historical price movements of an asset within a specific timeframe. By providing visual representations of price trends and patterns, they empower traders to make informed decisions.
How can price action indicators help in identifying price patterns?
The utilization of these indicators enhances a trader's ability to recognize potential entry and exit points, thereby contributing to the overall effectiveness of their trading strategy.
Price action indicators serve as dynamic tools that offer insights into the market's behavior. They contribute to the identification of various price patterns, enabling traders to discern trends and potential reversals. Through visual cues, these indicators facilitate a clearer understanding of the market conditions, allowing traders to adapt their strategies accordingly.
Best price action indicators
Moving averages
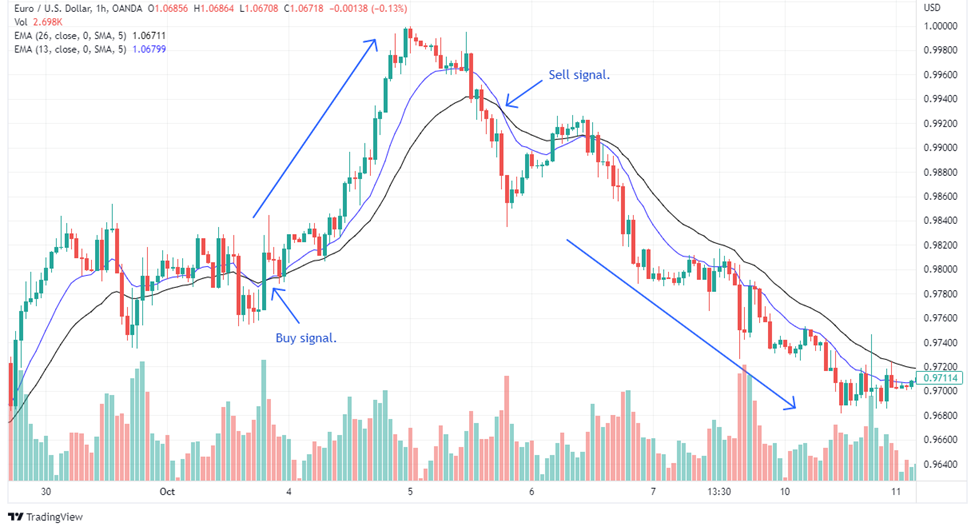
Moving averages
Moving averages are foundational indicators used to determine the trend direction and smoothen out price fluctuations. By calculating the average price of an asset over a specific period, moving averages provide a visual representation of the overall trend. Traders leverage this information to identify the prevailing market direction and potential trend changes.
MACD (Moving Average Convergence Divergence)
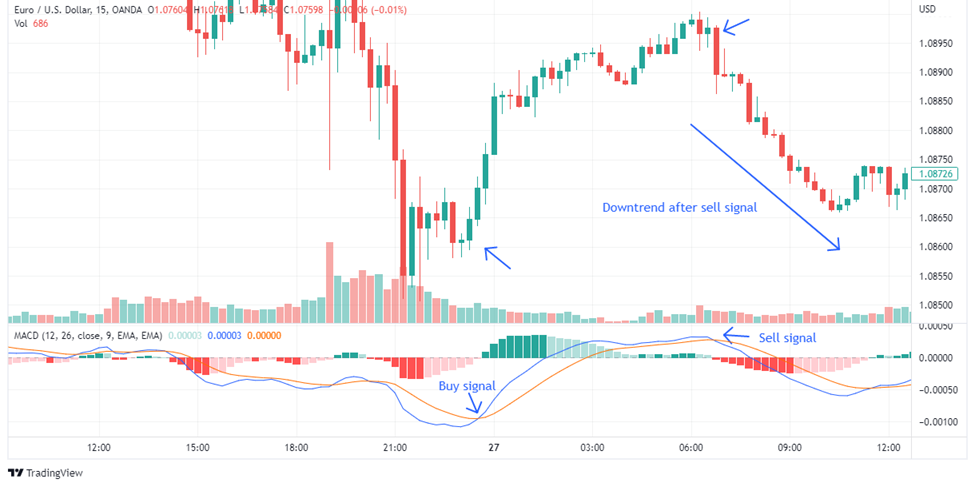
MACD (Moving Average Convergence Divergence)
MACD is a versatile indicator employed to identify shifts in momentum and trend direction. Comprising two moving averages - a fast one and a slow one - along with a histogram representing the difference between them, MACD offers a comprehensive view of trend dynamics. Traders interpret the MACD signals to gauge potential trend reversals or continuations.
RSI (Relative Strength Index)
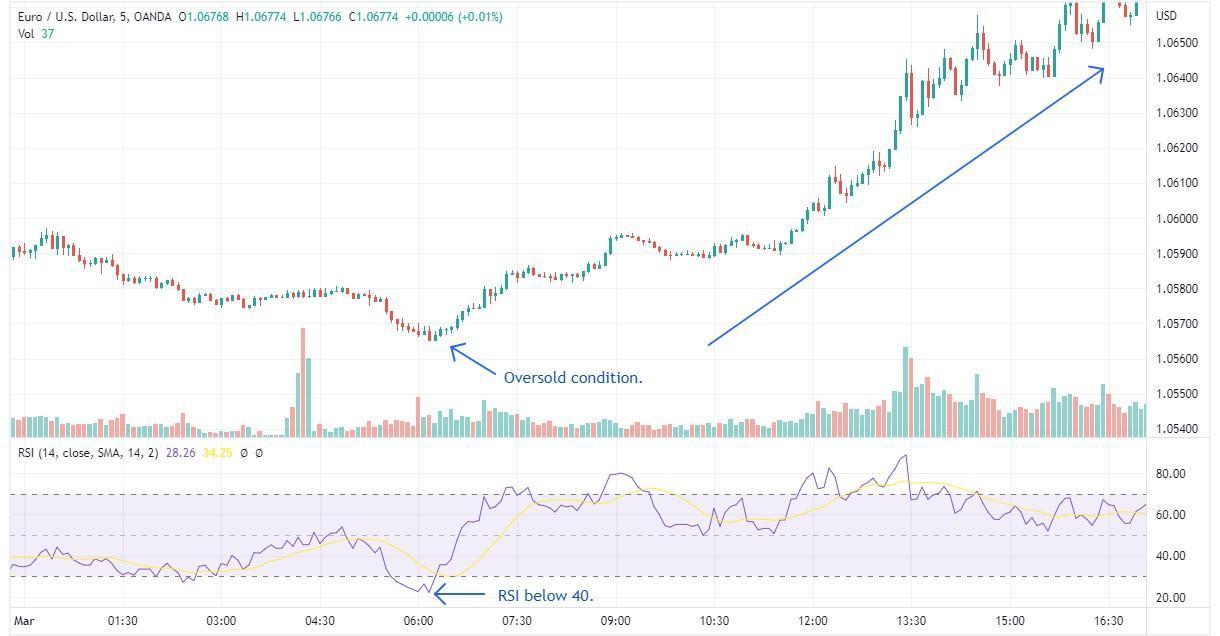
RSI (Relative Strength Index)
RSI is a momentum indicator employed to identify overbought or oversold conditions in the market. By measuring the strength of an asset's price action through the comparison of average gains and losses over a specific period, RSI provides insights into potential trend exhaustion or initiation.
How do these indicators contribute to identifying price patterns?
Price action indicators contribute to the identification of price patterns by offering visual cues and quantitative measures that highlight potential entry or exit points for trades. Moving averages, for instance, provide a smoothed representation of price trends, aiding in recognizing patterns such as upward or downward trends.
MACD, with its dual moving average structure and histogram, not only identifies trends but also signals potential changes in momentum. Bollinger Bands, by assessing volatility, help traders identify patterns indicative of overbought or oversold conditions. RSI, through its measurement of price strength, aids in recognizing situations where a trend may be losing steam or gaining momentum.
Advanced price action trading techniques
Advanced price action trading techniques, specifically Fibonacci retracement and Elliott Wave Theory, offer traders valuable insights for achieving a more profound understanding of market price action.
Fibonacci retracement
Fibonacci retracement is a sophisticated tool in technical analysis that utilizes horizontal lines to pinpoint areas of support or resistance at key Fibonacci levels. The core concept is rooted in the belief that markets tend to retrace a predictable portion of a move before resuming their original direction.
By applying Fibonacci retracement, traders can identify crucial levels of support and resistance, acting as strategic points for entering or exiting trades. These levels are determined by key Fibonacci ratios, providing traders with a systematic approach to understanding potential reversal or continuation points in the market.
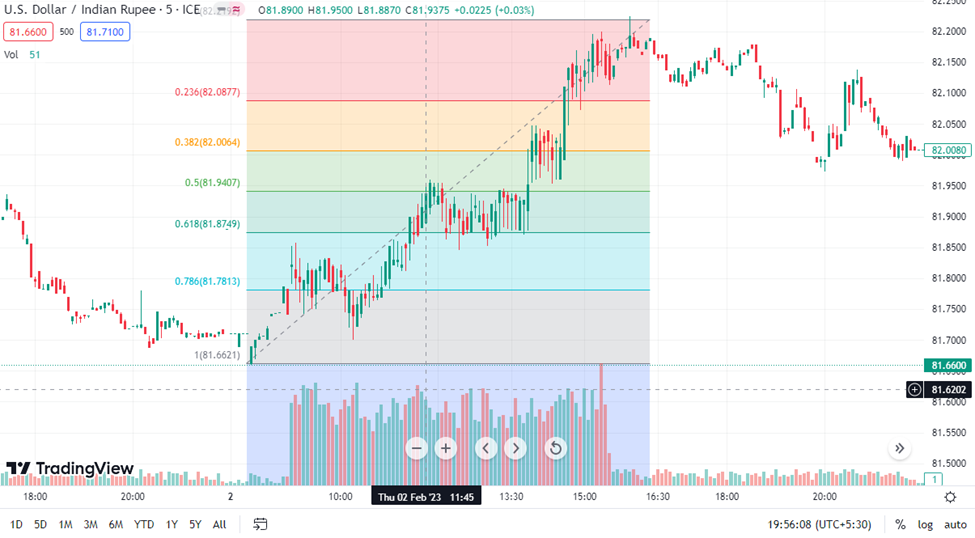
Fibonacci retracement
Elliott Wave Theory
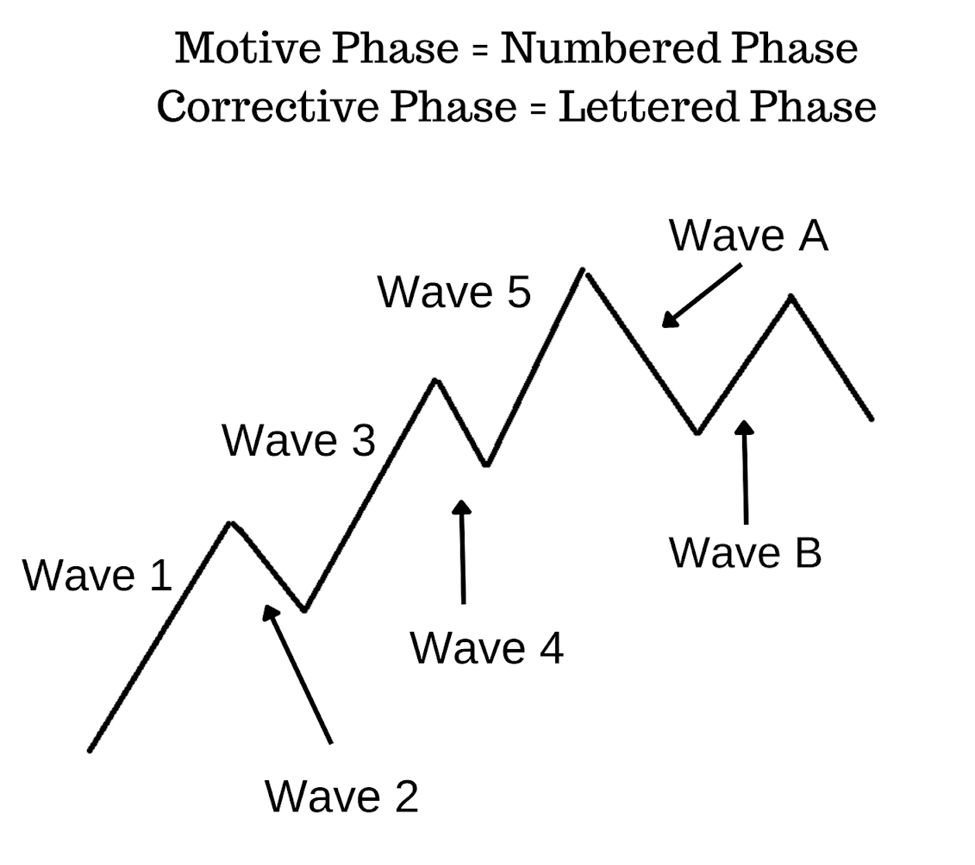
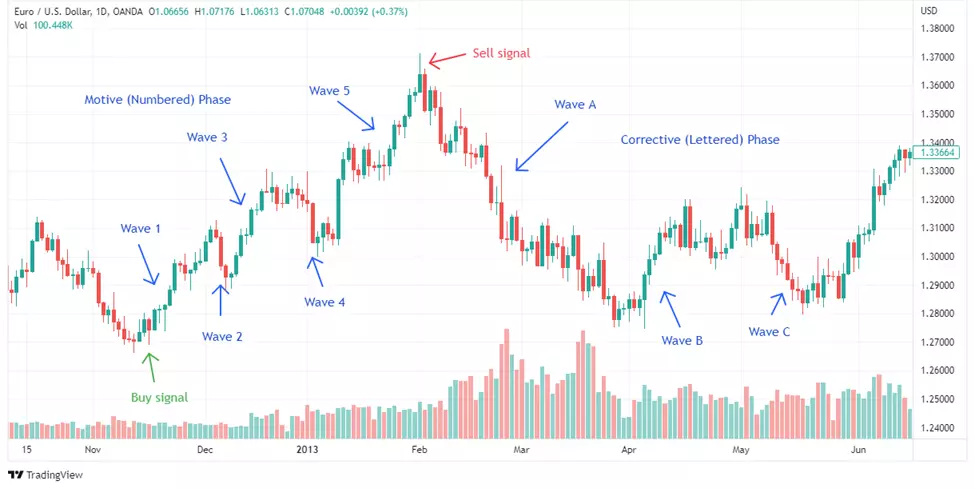
Elliott Wave Theory is another advanced tool in technical analysis that relies on wave patterns to discern market trends and reversals. According to this theory, markets move in a series of five waves in the direction of the trend, followed by three corrective waves.
Traders leveraging Elliott Wave Theory can identify potential trend reversals and make informed decisions based on the observed wave patterns. This technique adds a layer of sophistication to price action analysis, allowing traders to align their strategies with the broader market trends.
Elliott Wave Theory
Combining techniques for deeper insight
Integration
These advanced techniques, when used in conjunction with other technical analysis tools and strategies, empower traders to confirm price patterns and make well-informed decisions. The synergy of Fibonacci retracement and Elliott Wave Theory with existing analytical approaches enhances a trader's ability to navigate the complexities of market price action.
Strategic decision-making
The identification of key support and resistance levels through Fibonacci retracement, coupled with the trend insights from Elliott Wave Theory, provides traders with a comprehensive understanding of market dynamics. This, in turn, aids in strategic decision-making, helping traders to position themselves effectively in the market.
Confirmation of price patterns
The advanced nature of these techniques adds a layer of confirmation to price patterns, reducing the likelihood of false signals. Traders gain confidence in their analyses, making it more likely that their actions align with actual market conditions.
Recognizing false signals and market anomalies
What are false signals and how to identify them?
False signals in trading refer to indicators suggesting a trade opportunity that isn't favorable. They can mislead traders into entering or exiting a market prematurely, potentially leading to unfavorable outcomes. Identifying false signals is crucial to avoid making misguided trades. Utilizing technical analysis and incorporating multiple indicators in a trading strategy is an effective approach. By comparing signals from different indicators and implementing risk management techniques, traders can mitigate the impact of false signals.
What are the strategies to deal with false signals and market anomalies?
Dealing with false signals and market anomalies requires strategic approaches to safeguard trading decisions. Traders can employ the following strategies:
-
Using multiple indicators. Traders should rely on a combination of indicators to confirm signals before making decisions. This multi-indicator approach helps reduce the likelihood of false signals and enhances the accuracy of trading decisions
-
Comparing signals from different indicators. Cross-referencing signals from diverse indicators is a prudent strategy. Trades should only be executed when multiple indicators align, providing a more robust confirmation and decreasing the chances of acting on a false signal
-
Using risk management techniques. Implementing risk management techniques is essential to limit potential losses in the event of false signals. This proactive approach minimizes the impact of unfavorable trades on overall trading performance
-
Staying up to date with news events. Remaining informed about current news events is vital. Awareness of market manipulation and staying abreast of relevant news can significantly reduce the probability of false signals, contributing to more accurate trading decisions
Risk management for price action-based trading
What is the importance of risk management in binary options trading?
Risk management holds paramount importance in binary options trading, serving as a fundamental pillar for traders to safeguard their capital and navigate the complexities of the market successfully. Beyond merely identifying potentially profitable setups, the essence of successful trading lies in mastering risk management and understanding the psychological aspects that accompany it. By implementing effective risk management strategies, traders can shield themselves from significant losses and enhance the prospects of sustained profitability over the long term.
What are the different risk management techniques?
Several risk management techniques are pivotal for traders to adopt and integrate into their binary options trading strategies. These techniques include:
-
Determining risk/exposure upfront
Traders should judiciously assess and determine their risk/exposure upfront. A prudent approach involves risking no more than 1% of the account equity on a single position and limiting the overall risk to 5% across all open positions at any given time. This disciplined approach prevents catastrophic losses -
Optimal stop-loss level
Defining an optimal stop-loss level for each trade is essential. This technique helps limit losses in case of a market downturn, providing a predefined exit point that aligns with the trader's risk tolerance and the specific characteristics of the trade -
Profit taking
Implementing profit-taking strategies involves capturing gains at predetermined levels. This proactive approach not only secures profits but also guards against the temptation to hold onto a position for too long, minimizing exposure to potential reversals -
Protective puts
Traders can employ protective puts as an insurance mechanism against market downturns. Protective puts involve options contracts that grant traders the right to sell an asset at a predetermined price, acting as a safeguard to limit potential losses -
Diversification
Diversifying the portfolio is a strategic move to mitigate the impact of losses in a particular asset class on the overall portfolio. This technique spreads risk across different assets, reducing the vulnerability to adverse movements in any single market -
Position sizing
Determining the appropriate position size for each trade is a vital risk management technique. Tailoring position sizes based on individual risk tolerance and the size of the trading account ensures that no single trade has an outsized impact on the overall portfolio
Conclusion
In conclusion, mastering the art of binary options trading through the lens of price action involves a careful balance between identifying setups and implementing robust risk management. By adhering to fundamental risk management techniques—such as determining upfront exposure, setting optimal stop-loss levels, and employing protective puts—traders can safeguard against losses. Diversification and strategic position sizing further contribute to a resilient trading portfolio. The essence lies not only in recognizing price patterns and utilizing advanced techniques like Fibonacci retracement but also in implementing a disciplined and calculated approach to risk. Some important candlesticks that can aid binary traders are bullish and bearish engulfing, morning star, pin bar and inside bar patterns.
Team that worked on the article
Chinmay Soni is a financial analyst with more than 5 years of experience in working with stocks, Forex, derivatives, and other assets. As a founder of a boutique research firm and an active researcher, he covers various industries and fields, providing insights backed by statistical data. He is also an educator in the field of finance and technology.
As an author for Traders Union, he contributes his deep analytical insights on various topics, taking into account various aspects.
Dr. BJ Johnson is a PhD in English Language and an editor with over 15 years of experience. He earned his degree in English Language in the U.S and the UK. In 2020, Dr. Johnson joined the Traders Union team. Since then, he has created over 100 exclusive articles and edited over 300 articles of other authors.
The topics he covers include trading signals, cryptocurrencies, Forex brokers, stock brokers, expert advisors, binary options. He has also worked on the ratings of brokers and many other materials.
Dr. BJ Johnson’s motto: It always seems impossible until it’s done. You can do it.
Tobi Opeyemi Amure is an editor and expert writer with over 7 years of experience. In 2023, Tobi joined the Traders Union team as an editor and fact checker, making sure to deliver trustworthy and reliable content. The topics he covers include trading signals, cryptocurrencies, Forex brokers, stock brokers, expert advisors, binary options.
Tobi Opeyemi Amure motto: The journey of a thousand miles begins with a single step.


