

MSTR drops as increased share supply pressures stock

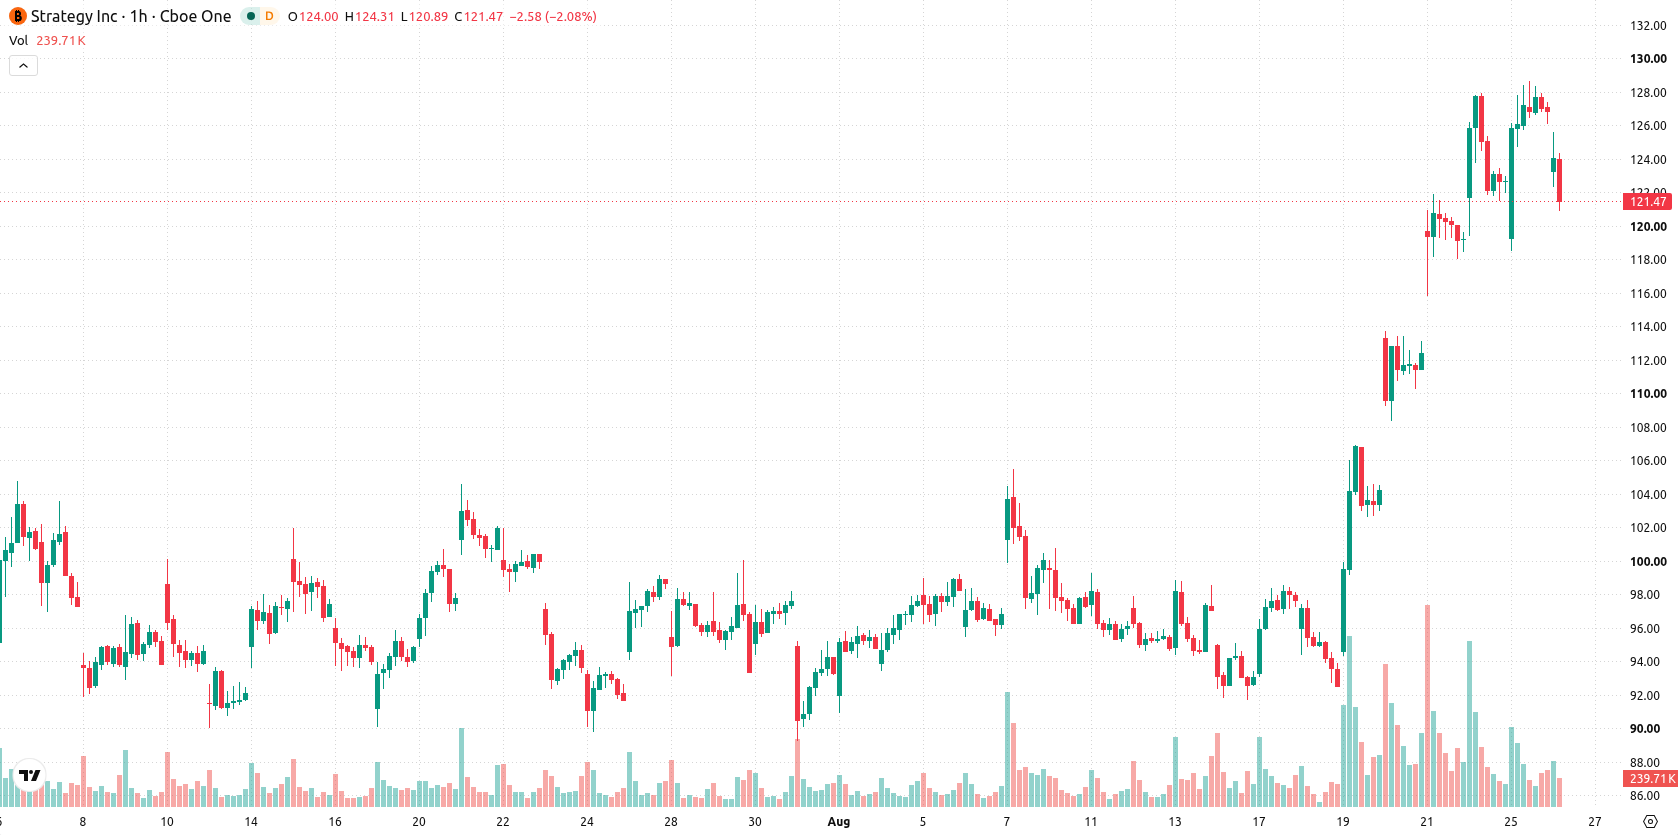
Strategy (MSTR, formerly MicroStrategy) stock is trading at $121.18 after falling 4.45% today, closing near the session low. The price stands below its key moving averages, indicating ongoing volatility and downward momentum relative to recent benchmarks.
 156.20
158.40
156.20
158.40
Highlights
- Strategy increased USD-denominated liquidity to $6.69 billion by creating a new $1.59 billion cash pool funded with $2.01 billion in share sales.
- Proceeds were partially used to repurchase STRC preferred shares and add to reserves, with no bitcoin purchases conducted during this period.
- Shares of Strategy faced short-term selling pressure amid high volatility, with anticipated price movement in the $112.1 to $130.26 range over the next several sessions.
Liquidity boost and share sales heighten flexibility but add supply risk
Strategy initiated a new USD Cash liquidity pool backed by $1.59 billion, financed through $2.01 billion in at-the-market share sales between August 17 and August 23, 2026, according to Digitaltoday Co. This move augmented the company's liquidity position, supporting increased flexibility for future bitcoin acquisition, debt servicing, and operational needs, but also increased share supply in the market. Part of the proceeds was directed to repurchase STRC preferred shares and boost reserves, while total USD-denominated liquidity reached $6.69 billion as of August 23, 2026, per Theglobeandmail. No bitcoin transactions were reported during the period, though price action has remained under broader selling pressure.
Mixed momentum signals as price tests key support and resistance
Technically, MSTR/USD is trading below the MA-20 at $123.84 but remains above its MA-50 at $110.8 on the hourly chart. On the daily timeframe, the price is under the long-term MA-200 at $142.7. The Ichimoku Kijun sits at $119.47, currently serving as immediate support. Momentum indicators show a mixed setup: MACD signals Strong Buy and ADX displays a Buy, with RSI and CCI both reading in bullish territory, while Stoch RSI is oversold. Bull/Bear Power is overbought, and the Awesome Oscillator is neutral, reflecting a split between implied medium-term resilience and intraday buyer dominance against lingering sell pressure.
Bullish scenario hinges on breakout amid contained downside risk
In the short term, the projected price corridor for MSTR/USD is $112.1 to $130.26, reflecting a volatility band relative to current levels. The probability of a move higher over the coming sessions is 64%, while downside risk is comparatively lower. The baseline scenario points to consolidation within this range, with a bullish outcome if the price decisively breaks above $130.26. Conversely, a drop below the $119.47 support would lean toward a retest of the lower boundary.
Earlier, analysts noted that Strategy’s share price recovery remained closely tied to Bitcoin’s performance within a broader downtrend despite improved liquidity measures. The latest developments highlight continued operational flexibility and reinforce the current scenario of price consolidation between $112.1 and $130.26, with a decisive move outside this range likely to set the next direction.





Latest Strategy News





-
 Afghanistan
-
 Albania
-
 Algeria
-
 Angola
-
 Argentina
-
 Armenia
-
 Australia
-
 Austria
-
 Azerbaijan
-
 Bahamas
-
 Bahrain
-
 Bangladesh
-
 Belarus
-
 Belgium
-
 Bolivia
-
 Botswana
-
 Brazil
-
 Brunei
-
 Bulgaria
-
 Cambodia
-
 Cameroon
-
 Canada
-
 Chile
Chile
-
 China
China
-
 Colombia
-
 Congo
Congo
-
 Costa Rica
-
 Cote d'Ivoire
-
 Croatia
-
 Cuba
Cuba
-
 Cyprus
-
 Czechia
-
 DR Congo
-
 Denmark
-
 Dominican Republic
-
 Ecuador
-
 Egypt
Egypt
-
 El Salvador
-
 Estonia
-
 Eswatini
-
 Ethiopia
-
 Finland
-
 France
-
 Georgia
-
 Germany
-
 Ghana
Ghana
-
 Greece
-
 Haiti
Haiti
-
 Hong Kong
-
 Hungary
-
 India
India
-
 Indonesia
-
 Iran, Islamic republic
-
 Iraq
Iraq
-
 Ireland
-
 Israel
-
 Italy
Italy
-
 Jamaica
-
 Japan
Japan
-
 Jordan
-
 Kazakhstan
-
 Kenya
Kenya
-
 Korea
Korea
-
 Kuwait
-
 Kyrgyzstan
-
 Laos
Laos
-
 Latvia
-
 Lebanon
-
 Lesotho
-
 Libya
Libya
-
 Lithuania
-
 Luxembourg
-
 Madagascar
-
 Malaysia
-
 Malta
Malta
-
 Mauritius
-
 Mexico
-
 Moldova
-
 Mongolia
-
 Montenegro
-
 Morocco
-
 Mozambique
-
 Myanmar
-
 Namibia
-
 Nepal
Nepal
-
 Netherlands
-
 New Zealand
-
 Nigeria
-
 North Macedonia
-
 Norway
-
 Oman
Oman
-
 Pakistan
-
 Palestine
-
 Panama
-
 Papua New Guinea
-
 Paraguay
-
 Peru
Peru
-
 Philippines
-
 Poland
-
 Portugal
-
 Puerto Rico
-
 Qatar
Qatar
-
 Reunion
-
 Romania
-
 Rwanda
-
 Saudi Arabia
-
 Serbia
-
 Singapore
-
 Slovakia
-
 Slovenia
-
 Somalia
-
 South Africa
-
 Spain
Spain
-
 Sri Lanka
-
 Sweden
-
 Switzerland
-
 Syria
Syria
-
 Taiwan
-
 Tajikistan
-
 Tanzania
-
 Thailand
-
 Trinidad and Tobago
-
 Tunisia
-
 Turkey
-
 UAE
UAE
-
 Uganda
-
 Ukraine
-
 United Kingdom
-
United States
-
 Uruguay
-
 Uzbekistan
-
 Venezuela
-
 Vietnam
-
 Yemen
Yemen
-
 Zambia
-
 Zimbabwe
- Forex
- Crypto












