
TIA latest news: Trades near upper daily range — bullish attempt amid broader selloff

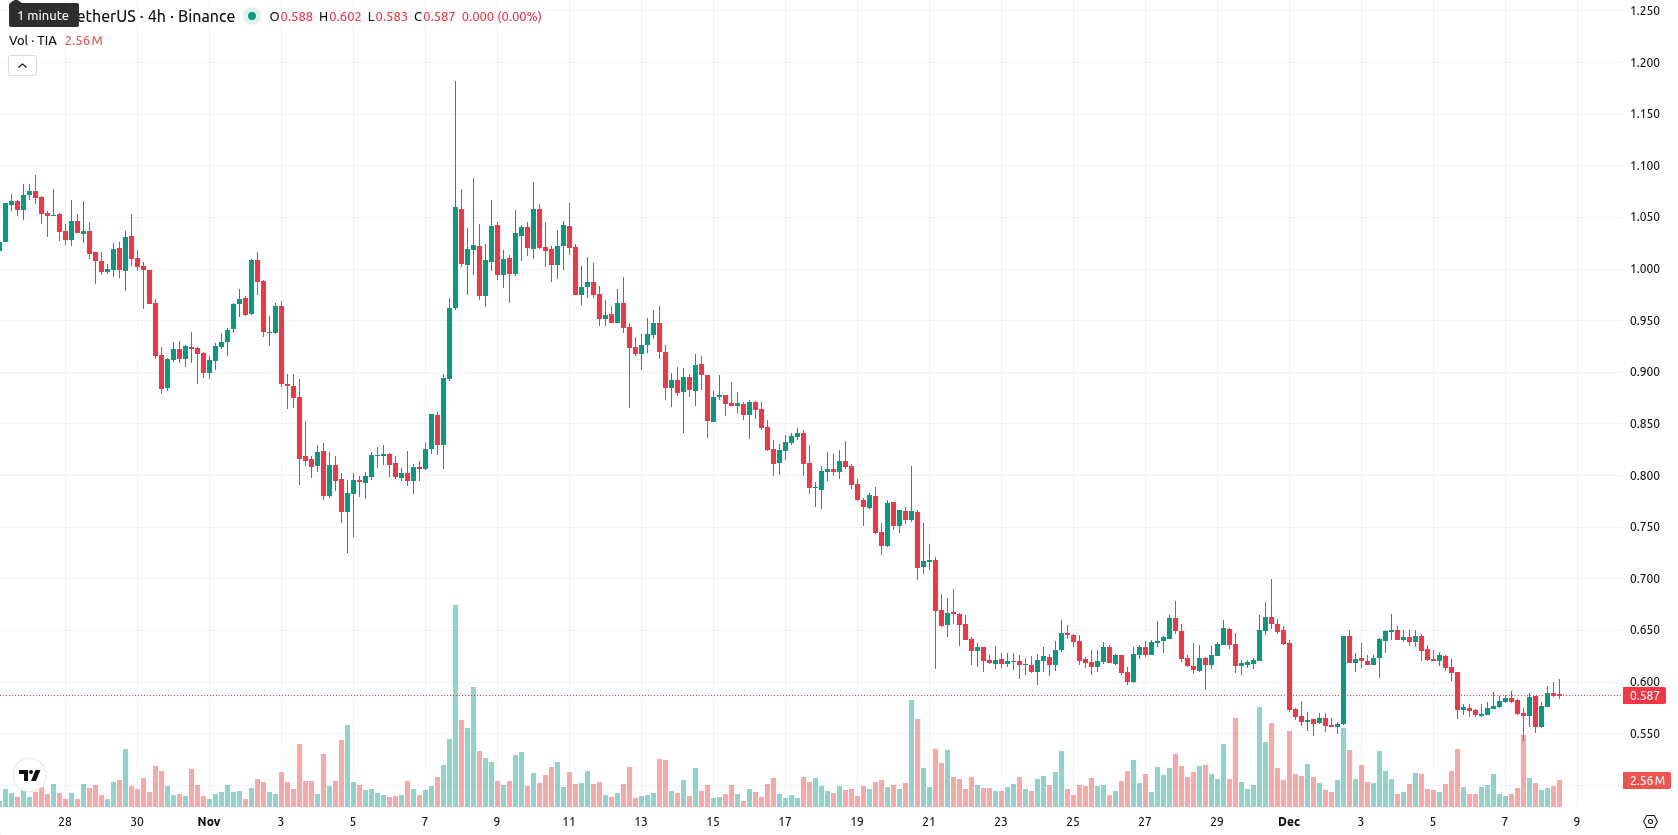
Celestia (TIA) is trading at $0.597 after gaining 8.55% on the day, staying below its MA-20 ($0.6393), MA-50 ($0.8241), and MA-200 ($1.5111) — a sign of strong selling pressure across all major timeframes. The price currently sits near the upper end of today’s range, testing resistance amid persistent bearish momentum.
Highlights
- Celestia (TIA) is trading at $0.597, remaining below its MA-20 ($0.6393), MA-50 ($0.8241), and MA-200 ($1.5111), indicating entrenched bearish momentum across all timeframes.
- Despite a daily gain of 8.55% (current price $0.597; prior close $0.55), technical signals including MACD (strong sell) and ADX (sell, 29.0) reinforce seller dominance with key resistance at the Ichimoku Kijun ($0.7695).
- TIA is forecasted to trade sideways within the $0.54 to $0.66 range over the next 5 days, with less than 20% probability of price appreciation and bearish pressure likely to persist.
Downtrend intensifies as indicators confirm oversold conditions
TIA remains under significant bearish influence as key moving averages are overhead, with immediate resistance at the Ichimoku Kijun level ($0.7695) and support near recent lows. Momentum indicators reinforce the negative tone: MACD signals a strong sell, ADX is bearish at 29.0, while RSI and CCI readings persist in the low 30s, pointing to oversold conditions. Though Stoch RSI is neutral and BBP at –0.03 signals seller dominance intraday, the ongoing session shows intensified buying at the highs against the overall bearish backdrop. There is a marked divergence between the bullish intraday move and the prevailing longer-term downturn.
Limited upside seen as volatility bands cap short-term outlook
Over the next 5 trading days, TIA is expected to trade within a typical volatility band relative to current levels between $0.54 and $0.66. The chance of a price increase remains very low (less than 20%), so further downside is more likely. The base case is continued range-bound action between support and resistance levels. A sustained break above $0.77 would be needed for a bullish reversal, while a fall through $0.54 could signal another test of recent lows.
Previously it was reported that Celestia (TIA) continued to trade below its short-, medium-, and long-term moving averages, with bearish momentum confirmed across daily and weekly technical indicators such as MACD, ADX, and RSI, highlighting sellers’ control and a lack of meaningful support in the current price zone. The session exhibited a negative intraday outlook and persistent downside risk dominates as consolidation is expected within a limited price corridor barring any breakout above defined resistance levels.


Latest Celestia News


-
 Afghanistan
-
 Albania
-
 Algeria
-
 Angola
-
 Argentina
-
 Armenia
-
 Australia
-
 Austria
-
 Azerbaijan
-
 Bahamas
-
 Bahrain
-
 Bangladesh
-
 Belarus
-
 Belgium
-
 Bolivia
-
 Botswana
-
 Brazil
-
 Brunei
-
 Bulgaria
-
 Cambodia
-
 Cameroon
-
 Canada
-
 Chile
Chile
-
 China
China
-
 Colombia
-
 Congo
Congo
-
 Costa Rica
-
 Cote d'Ivoire
-
 Croatia
-
 Cuba
Cuba
-
 Cyprus
-
 Czechia
-
 DR Congo
-
 Denmark
-
 Dominican Republic
-
 Ecuador
-
 Egypt
Egypt
-
 El Salvador
-
 Estonia
-
 Eswatini
-
 Ethiopia
-
 Finland
-
 France
-
 Georgia
-
 Germany
-
 Ghana
Ghana
-
 Greece
-
 Haiti
Haiti
-
 Hong Kong
-
 Hungary
-
 India
India
-
 Indonesia
-
 Iran, Islamic republic
-
 Iraq
Iraq
-
 Ireland
-
 Israel
-
 Italy
Italy
-
 Jamaica
-
 Japan
Japan
-
 Jordan
-
 Kazakhstan
-
 Kenya
Kenya
-
 Korea
Korea
-
 Kuwait
-
 Kyrgyzstan
-
 Laos
Laos
-
 Latvia
-
 Lebanon
-
 Lesotho
-
 Libya
Libya
-
 Lithuania
-
 Luxembourg
-
 Madagascar
-
 Malaysia
-
 Malta
Malta
-
 Mauritius
-
 Mexico
-
 Moldova
-
 Mongolia
-
 Montenegro
-
 Morocco
-
 Mozambique
-
 Myanmar
-
 Namibia
-
 Nepal
Nepal
-
 Netherlands
-
 New Zealand
-
 Nigeria
-
 North Macedonia
-
 Norway
-
 Oman
Oman
-
 Pakistan
-
 Palestine
-
 Panama
-
 Papua New Guinea
-
 Paraguay
-
 Peru
Peru
-
 Philippines
-
 Poland
-
 Portugal
-
 Puerto Rico
-
 Qatar
Qatar
-
 Reunion
-
 Romania
-
 Rwanda
-
 Saudi Arabia
-
 Serbia
-
 Singapore
-
 Slovakia
-
 Slovenia
-
 Somalia
-
 South Africa
-
 Spain
Spain
-
 Sri Lanka
-
 Sweden
-
 Switzerland
-
 Syria
Syria
-
 Taiwan
-
 Tajikistan
-
 Tanzania
-
 Thailand
-
 Trinidad and Tobago
-
 Tunisia
-
 Turkey
-
 UAE
UAE
-
 Uganda
-
 Ukraine
-
 United Kingdom
-
United States
-
 Uruguay
-
 Uzbekistan
-
 Venezuela
-
 Vietnam
-
 Yemen
Yemen
-
 Zambia
-
 Zimbabwe
- Forex
- Crypto
