
Trump price prediction: Sideways action ahead? Gains 3.42% despite bearish pressures

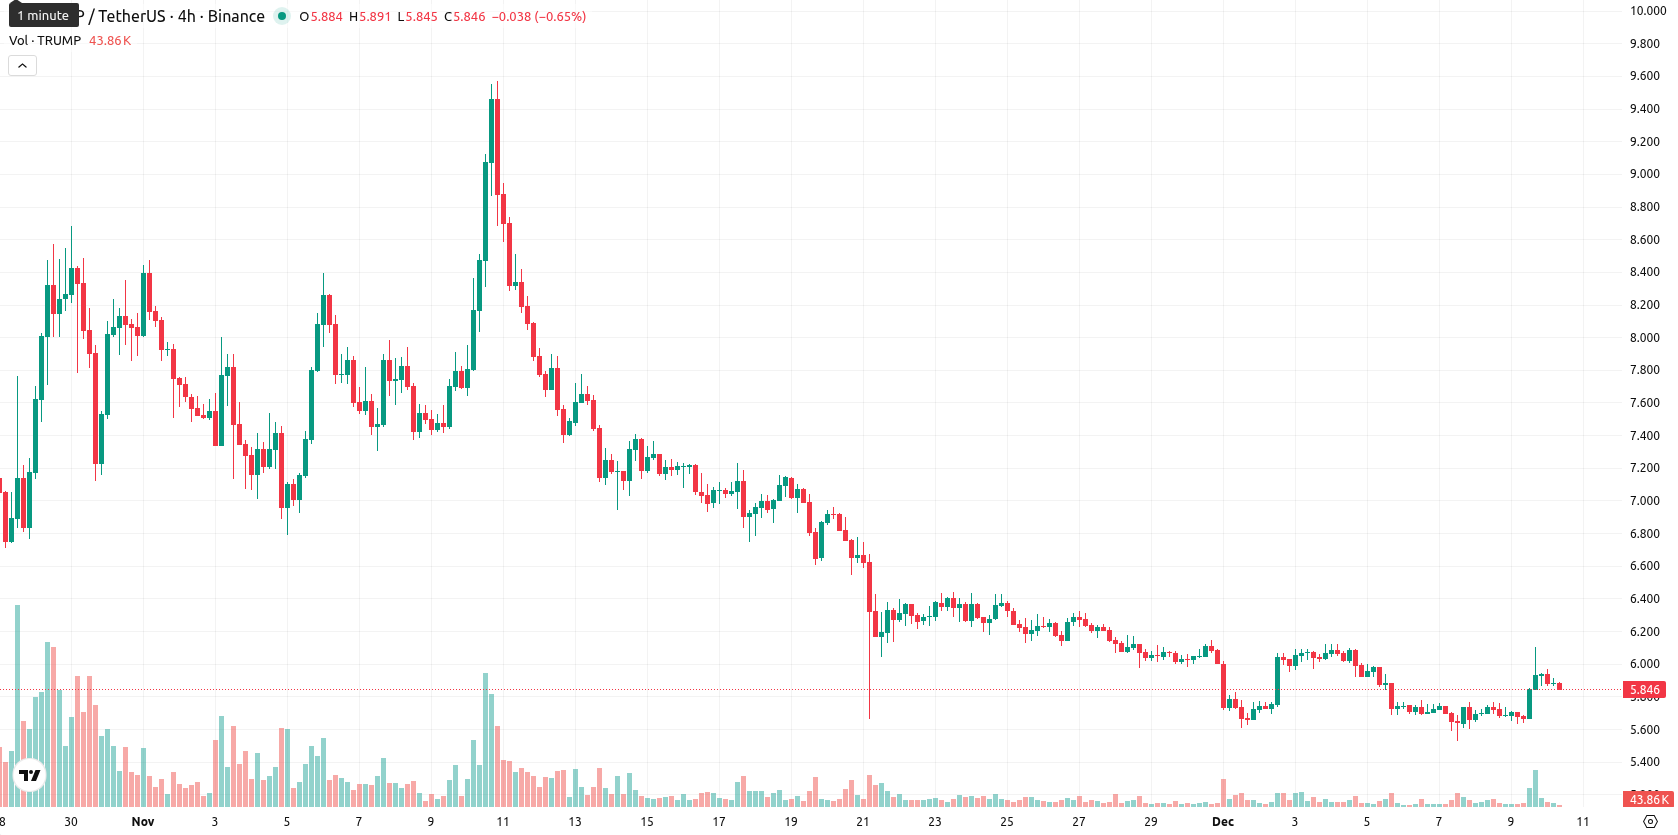
Official Trump (TRUMP) is currently trading at $5.87, below both the MA-20 ($6.05) and MA-50 ($6.74), which signals ongoing short- and medium-term downward pressure. The price is also well below the MA-200 ($8.43), confirming persistent long-term selling bias, while the nearest dynamic resistance is at the Ichimoku Kijun level ($6.47) and immediate support remains just above $5.86, today’s low.
Highlights
- TRUMP trades at $5.87, remaining below MA-20 ($6.05), MA-50 ($6.74), and MA-200 ($8.43), indicating sustained bearish momentum across all timeframes.
- Oscillators such as RSI (42.5), CCI (–55.9), and neutral Awesome Oscillator show no oversold signal, while Stoch RSI is overbought, reflecting mixed short-term sentiment and lack of clear direction.
- Technical outlook favors a sideways to bearish bias within a $5.75–$6.45 range for the next five days, with less than 20% probability of upside breakout above Ichimoku Kijun resistance at $6.47.
Contradictory momentum signals as oscillators diverge on daily chart
Momentum signals on the daily chart are mixed: MACD and ADX both indicate weak bearish momentum, but oversold conditions are not confirmed as RSI sits at 42.5 and CCI at –55.9, with Stoch RSI in overbought territory, signaling a possible pause or short-term reversal. BBP flashes buyer dominance intraday, and the Awesome Oscillator remains neutral. The current price shows a moderate gain of 3.42% versus the previous session, opening with a slight gap up and now trading around the mid-range of today’s session ($5.86 – $5.97), suggesting moderate volatility after early upward strength but no clear follow-through. Divergence between oscillators and momentum indicators highlights a lack of directional conviction for now.
Bearish outlook prevails amid weak rally prospects for coming week
For the next five trading days, an adjusted expected price range is $5.75 to $6.45, keeping within a typical volatility band relative to current levels. The probability of a price increase is very low (less than 20%), making a further decline more likely based on the overwhelmingly bearish weekly momentum and trend signals (RSI, ADX, MACD all negative on W1). The baseline scenario is sideways movement within $5.75 – $6.45. A bullish scenario would require a break above $6.47 (Ichimoku resistance), while a bearish scenario could see the price slip below $5.75 if seller momentum strengthens.
Previously it was reported that TRUMP was trading below all key moving averages, with persistent bearish momentum and oscillators nearing oversold territory while momentum indicators like MACD and ADX continued to signal downside pressure. Resistance was defined within a consolidation band as analysts expected limited recovery prospects, citing persistent downward pressure across short-, medium-, and long-term horizons and a bias for further declines.


-
 Afghanistan
-
 Albania
-
 Algeria
-
 Angola
-
 Argentina
-
 Armenia
-
 Australia
-
 Austria
-
 Azerbaijan
-
 Bahamas
-
 Bahrain
-
 Bangladesh
-
 Belarus
-
 Belgium
-
 Bolivia
-
 Botswana
-
 Brazil
-
 Brunei
-
 Bulgaria
-
 Cambodia
-
 Cameroon
-
 Canada
-
 Chile
Chile
-
 China
China
-
 Colombia
-
 Congo
Congo
-
 Costa Rica
-
 Cote d'Ivoire
-
 Croatia
-
 Cuba
Cuba
-
 Cyprus
-
 Czechia
-
 DR Congo
-
 Denmark
-
 Dominican Republic
-
 Ecuador
-
 Egypt
Egypt
-
 El Salvador
-
 Estonia
-
 Eswatini
-
 Ethiopia
-
 Finland
-
 France
-
 Georgia
-
 Germany
-
 Ghana
Ghana
-
 Greece
-
 Haiti
Haiti
-
 Hong Kong
-
 Hungary
-
 India
India
-
 Indonesia
-
 Iran, Islamic republic
-
 Iraq
Iraq
-
 Ireland
-
 Israel
-
 Italy
Italy
-
 Jamaica
-
 Japan
Japan
-
 Jordan
-
 Kazakhstan
-
 Kenya
Kenya
-
 Korea
Korea
-
 Kuwait
-
 Kyrgyzstan
-
 Laos
Laos
-
 Latvia
-
 Lebanon
-
 Lesotho
-
 Libya
Libya
-
 Lithuania
-
 Luxembourg
-
 Madagascar
-
 Malaysia
-
 Malta
Malta
-
 Mauritius
-
 Mexico
-
 Moldova
-
 Mongolia
-
 Montenegro
-
 Morocco
-
 Mozambique
-
 Myanmar
-
 Namibia
-
 Nepal
Nepal
-
 Netherlands
-
 New Zealand
-
 Nigeria
-
 North Macedonia
-
 Norway
-
 Oman
Oman
-
 Pakistan
-
 Palestine
-
 Panama
-
 Papua New Guinea
-
 Paraguay
-
 Peru
Peru
-
 Philippines
-
 Poland
-
 Portugal
-
 Puerto Rico
-
 Qatar
Qatar
-
 Reunion
-
 Romania
-
 Rwanda
-
 Saudi Arabia
-
 Serbia
-
 Singapore
-
 Slovakia
-
 Slovenia
-
 Somalia
-
 South Africa
-
 Spain
Spain
-
 Sri Lanka
-
 Sweden
-
 Switzerland
-
 Syria
Syria
-
 Taiwan
-
 Tajikistan
-
 Tanzania
-
 Thailand
-
 Trinidad and Tobago
-
 Tunisia
-
 Turkey
-
 UAE
UAE
-
 Uganda
-
 Ukraine
-
 United Kingdom
-
United States
-
 Uruguay
-
 Uzbekistan
-
 Venezuela
-
 Vietnam
-
 Yemen
Yemen
-
 Zambia
-
 Zimbabwe
- Forex
- Crypto
