
Consolidation for Toncoin — price range narrows amid prevailing bearish bias

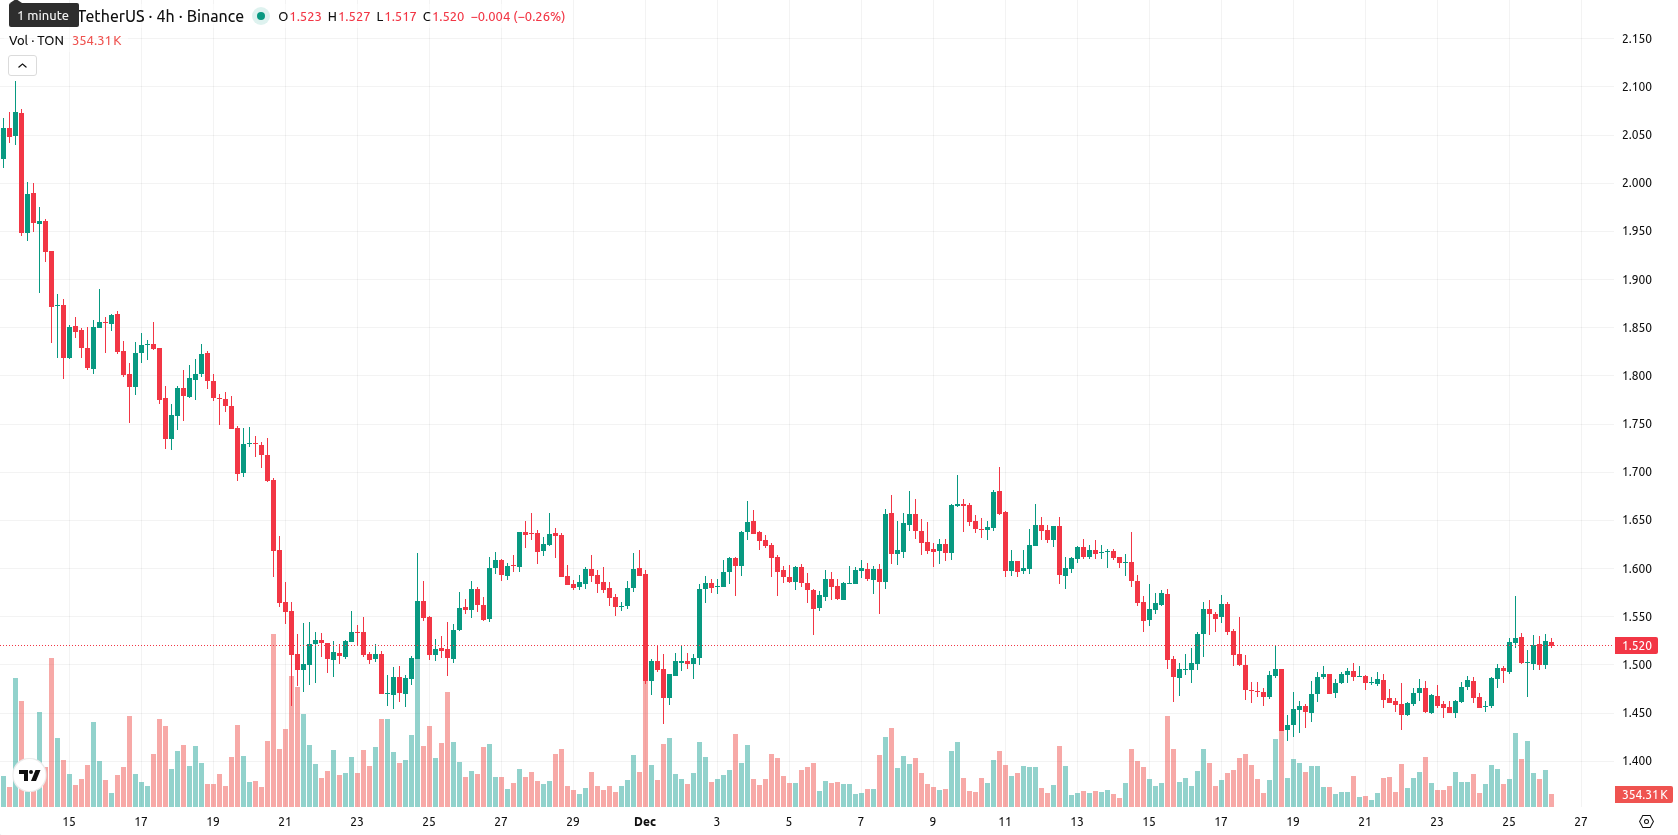
Toncoin (TON) is currently trading at $1.521, positioned below the MA-20 ($1.545), MA-50 ($1.663), and well below the MA-200 ($2.609), indicating a prevailing bearish bias for both medium- and long-term trends. The nearest dynamic resistance is the MA-20 at $1.545, while support can be found near the Ichimoku Kijun level at $1.561.
Highlights
- TON trades at $1.521, remaining below MA-20 ($1.545), MA-50 ($1.663), and MA-200 ($2.609), confirming a prevailing bearish trend across all timeframes.
- Momentum signals are mixed as MACD signals strong selling, ADX shows a strong trend, RSI is below 50, and Stoch RSI is overbought; intraday trading shows a 0.48% price drop.
- The five-day expected range is $1.45–$1.55 with less than 20% probability of a breakout, implying sideways consolidation or potential downside toward the $1.43 support zone.
Divergent momentum signals amid strong trend and intraday consolidation
Momentum signals are mixed: the MACD on the daily chart shows strong selling pressure, confirmed by an elevated ADX indicating a strong trend, but RSI is below 50 and points to further weakness, while Stoch RSI hovers in overbought territory and CCI is neutral. Bull/Bear Power (BBP) reflects modest buyer activity intraday, yet the Awesome Oscillator remains neutral. Today, the price eased 0.48% with no significant gap at the open; it is currently in the middle of the day’s range ($1.495 – $1.532), with moderate volatility observed so far and a tone of sideways consolidation, highlighting ongoing divergence between bullish oscillators and bearish momentum signals.
Sideways price outlook as upside risks remain limited
For the next five trading days, the expected price band is $1.45 to $1.55, reflecting typical volatility near current levels. There is a very low probability (less than 20%) of a significant move higher, and a downside move is more likely. The base case is continued sideways action between $1.45 and $1.55, with resistance near $1.55 – $1.57 and support at $1.45 or potentially down to $1.43 if selling accelerates.
Previously it was reported that Toncoin trades below its key moving averages, with momentum indicators such as MACD and ADX signaling persistent seller dominance and a broadly bearish outlook. Immediate resistance remains at the Ichimoku Kijun while RSI suggests mild bearishness, pointing to likely consolidation in a narrow range over the coming sessions.


Latest TON News


-
 Afghanistan
-
 Albania
-
 Algeria
-
 Angola
-
 Argentina
-
 Armenia
-
 Australia
-
 Austria
-
 Azerbaijan
-
 Bahamas
-
 Bahrain
-
 Bangladesh
-
 Belarus
-
 Belgium
-
 Bolivia
-
 Botswana
-
 Brazil
-
 Brunei
-
 Bulgaria
-
 Cambodia
-
 Cameroon
-
 Canada
-
 Chile
Chile
-
 China
China
-
 Colombia
-
 Congo
Congo
-
 Costa Rica
-
 Cote d'Ivoire
-
 Croatia
-
 Cuba
Cuba
-
 Cyprus
-
 Czechia
-
 DR Congo
-
 Denmark
-
 Dominican Republic
-
 Ecuador
-
 Egypt
Egypt
-
 El Salvador
-
 Estonia
-
 Eswatini
-
 Ethiopia
-
 Finland
-
 France
-
 Georgia
-
 Germany
-
 Ghana
Ghana
-
 Greece
-
 Haiti
Haiti
-
 Hong Kong
-
 Hungary
-
 India
India
-
 Indonesia
-
 Iran, Islamic republic
-
 Iraq
Iraq
-
 Ireland
-
 Israel
-
 Italy
Italy
-
 Jamaica
-
 Japan
Japan
-
 Jordan
-
 Kazakhstan
-
 Kenya
Kenya
-
 Korea
Korea
-
 Kuwait
-
 Kyrgyzstan
-
 Laos
Laos
-
 Latvia
-
 Lebanon
-
 Lesotho
-
 Libya
Libya
-
 Lithuania
-
 Luxembourg
-
 Madagascar
-
 Malaysia
-
 Malta
Malta
-
 Mauritius
-
 Mexico
-
 Moldova
-
 Mongolia
-
 Montenegro
-
 Morocco
-
 Mozambique
-
 Myanmar
-
 Namibia
-
 Nepal
Nepal
-
 Netherlands
-
 New Zealand
-
 Nigeria
-
 North Macedonia
-
 Norway
-
 Oman
Oman
-
 Pakistan
-
 Palestine
-
 Panama
-
 Papua New Guinea
-
 Paraguay
-
 Peru
Peru
-
 Philippines
-
 Poland
-
 Portugal
-
 Puerto Rico
-
 Qatar
Qatar
-
 Reunion
-
 Romania
-
 Rwanda
-
 Saudi Arabia
-
 Serbia
-
 Singapore
-
 Slovakia
-
 Slovenia
-
 Somalia
-
 South Africa
-
 Spain
Spain
-
 Sri Lanka
-
 Sweden
-
 Switzerland
-
 Syria
Syria
-
 Taiwan
-
 Tajikistan
-
 Tanzania
-
 Thailand
-
 Trinidad and Tobago
-
 Tunisia
-
 Turkey
-
 UAE
UAE
-
 Uganda
-
 Ukraine
-
 United Kingdom
-
United States
-
 Uruguay
-
 Uzbekistan
-
 Venezuela
-
 Vietnam
-
 Yemen
Yemen
-
 Zambia
-
 Zimbabwe
- Forex
- Crypto
