
BNB slips as daily momentum stays negative and sellers dominate

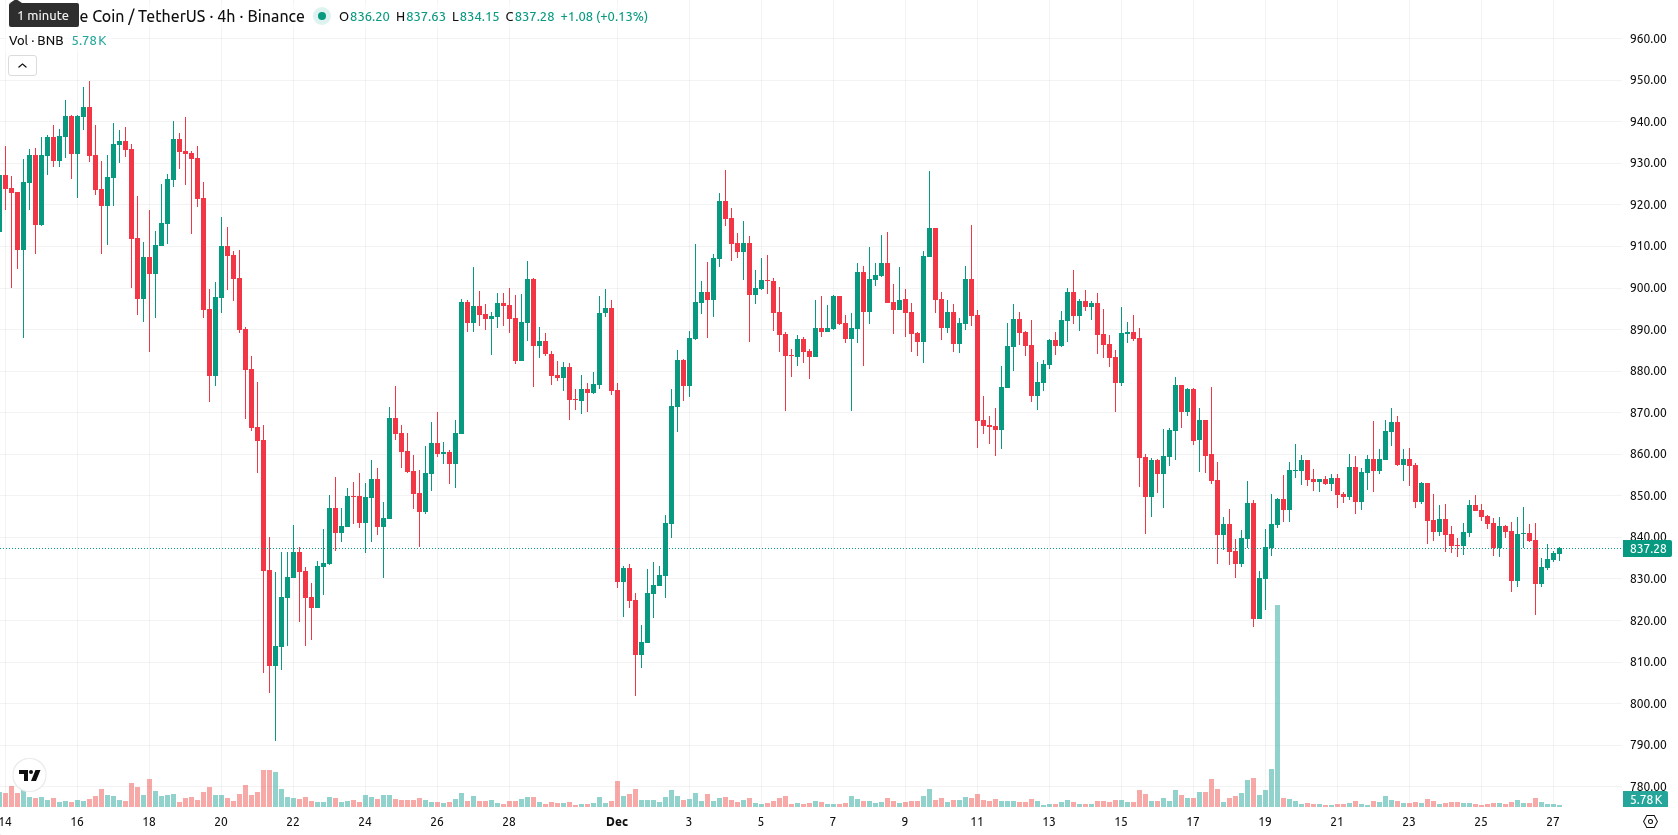
Binance coin (BNB) is trading at $837.30, which is below its MA-20 ($865.70), MA-50 ($889.20), and MA-200 ($879.50), signalling ongoing pressure from sellers across short, medium, and long-term trends.
Highlights
- BNB trades at $837.30, below its MA-20 ($865.70), MA-50 ($889.20), and MA-200 ($879.50), indicating persistent bearish pressure across all timeframes.
- Momentum indicators including MACD, ADX, RSI (39.9), and CCI (-106.4) confirm oversold, bearish conditions, with the Awesome Oscillator and BBP at -5.4 underscoring seller dominance.
- BNB is expected to fluctuate within a $820–$870 range over the next five days, with less than 20% probability of upside and further declines likely if $834.00 fails.
Bearish momentum confirmed as resistance converges with tight trading
The closest dynamic resistance for BNB is the Ichimoku Kijun level at $865.00, while immediate support is forming just below the current price; there are no crossing signals between the MA-50 and MA-200. Daily momentum indicators confirm a bearish setup, with MACD and ADX both negative, and RSI at 39.9 and CCI at -106.4 pointing to mild oversold conditions. BBP at -5.4 signals intraday seller dominance, and the Awesome Oscillator’s “Sell” bias provides further downside confirmation. The price is trading near the midpoint of today’s tight $834.50 – $836.50 range, which aligns with continued low volatility and moderate selling after the open.
Low breakout odds as oversold conditions curb upside
Over the next five trading days, BNB is likely to fluctuate within a typical volatility band of $820 to $870. The odds of an upward breakout are low, less than 20%, favoring a potential decline in the short term. The baseline scenario implies sideways movement supported by oversold technicals and capped by resistance at $865.00. An upward move above this level could push toward $870, while a drop below $834.00 would confirm further weakness unless new buying interest emerges.
Previously it was reported that Binance Coin (BNB) is trading below key moving averages, with technical indicators such as MACD, ADX, and RSI signaling ongoing bearish momentum and mildly oversold conditions. Immediate resistance is identified near $865, support around $808, and the price is expected to oscillate sideways within this band unless a decisive breakout occurs.


-
 Afghanistan
-
 Albania
-
 Algeria
-
 Angola
-
 Argentina
-
 Armenia
-
 Australia
-
 Austria
-
 Azerbaijan
-
 Bahamas
-
 Bahrain
-
 Bangladesh
-
 Belarus
-
 Belgium
-
 Bolivia
-
 Botswana
-
 Brazil
-
 Brunei
-
 Bulgaria
-
 Cambodia
-
 Cameroon
-
 Canada
-
 Chile
Chile
-
 China
China
-
 Colombia
-
 Congo
Congo
-
 Costa Rica
-
 Cote d'Ivoire
-
 Croatia
-
 Cuba
Cuba
-
 Cyprus
-
 Czechia
-
 DR Congo
-
 Denmark
-
 Dominican Republic
-
 Ecuador
-
 Egypt
Egypt
-
 El Salvador
-
 Estonia
-
 Eswatini
-
 Ethiopia
-
 Finland
-
 France
-
 Georgia
-
 Germany
-
 Ghana
Ghana
-
 Greece
-
 Haiti
Haiti
-
 Hong Kong
-
 Hungary
-
 India
India
-
 Indonesia
-
 Iran, Islamic republic
-
 Iraq
Iraq
-
 Ireland
-
 Israel
-
 Italy
Italy
-
 Jamaica
-
 Japan
Japan
-
 Jordan
-
 Kazakhstan
-
 Kenya
Kenya
-
 Korea
Korea
-
 Kuwait
-
 Kyrgyzstan
-
 Laos
Laos
-
 Latvia
-
 Lebanon
-
 Lesotho
-
 Libya
Libya
-
 Lithuania
-
 Luxembourg
-
 Madagascar
-
 Malaysia
-
 Malta
Malta
-
 Mauritius
-
 Mexico
-
 Moldova
-
 Mongolia
-
 Montenegro
-
 Morocco
-
 Mozambique
-
 Myanmar
-
 Namibia
-
 Nepal
Nepal
-
 Netherlands
-
 New Zealand
-
 Nigeria
-
 North Macedonia
-
 Norway
-
 Oman
Oman
-
 Pakistan
-
 Palestine
-
 Panama
-
 Papua New Guinea
-
 Paraguay
-
 Peru
Peru
-
 Philippines
-
 Poland
-
 Portugal
-
 Puerto Rico
-
 Qatar
Qatar
-
 Reunion
-
 Romania
-
 Rwanda
-
 Saudi Arabia
-
 Serbia
-
 Singapore
-
 Slovakia
-
 Slovenia
-
 Somalia
-
 South Africa
-
 Spain
Spain
-
 Sri Lanka
-
 Sweden
-
 Switzerland
-
 Syria
Syria
-
 Taiwan
-
 Tajikistan
-
 Tanzania
-
 Thailand
-
 Trinidad and Tobago
-
 Tunisia
-
 Turkey
-
 UAE
UAE
-
 Uganda
-
 Ukraine
-
 United Kingdom
-
United States
-
 Uruguay
-
 Uzbekistan
-
 Venezuela
-
 Vietnam
-
 Yemen
Yemen
-
 Zambia
-
 Zimbabwe
- Forex
- Crypto
