
XRP: broad selling pressure overshadows institutional adoption, resulting in a 1.06% decline

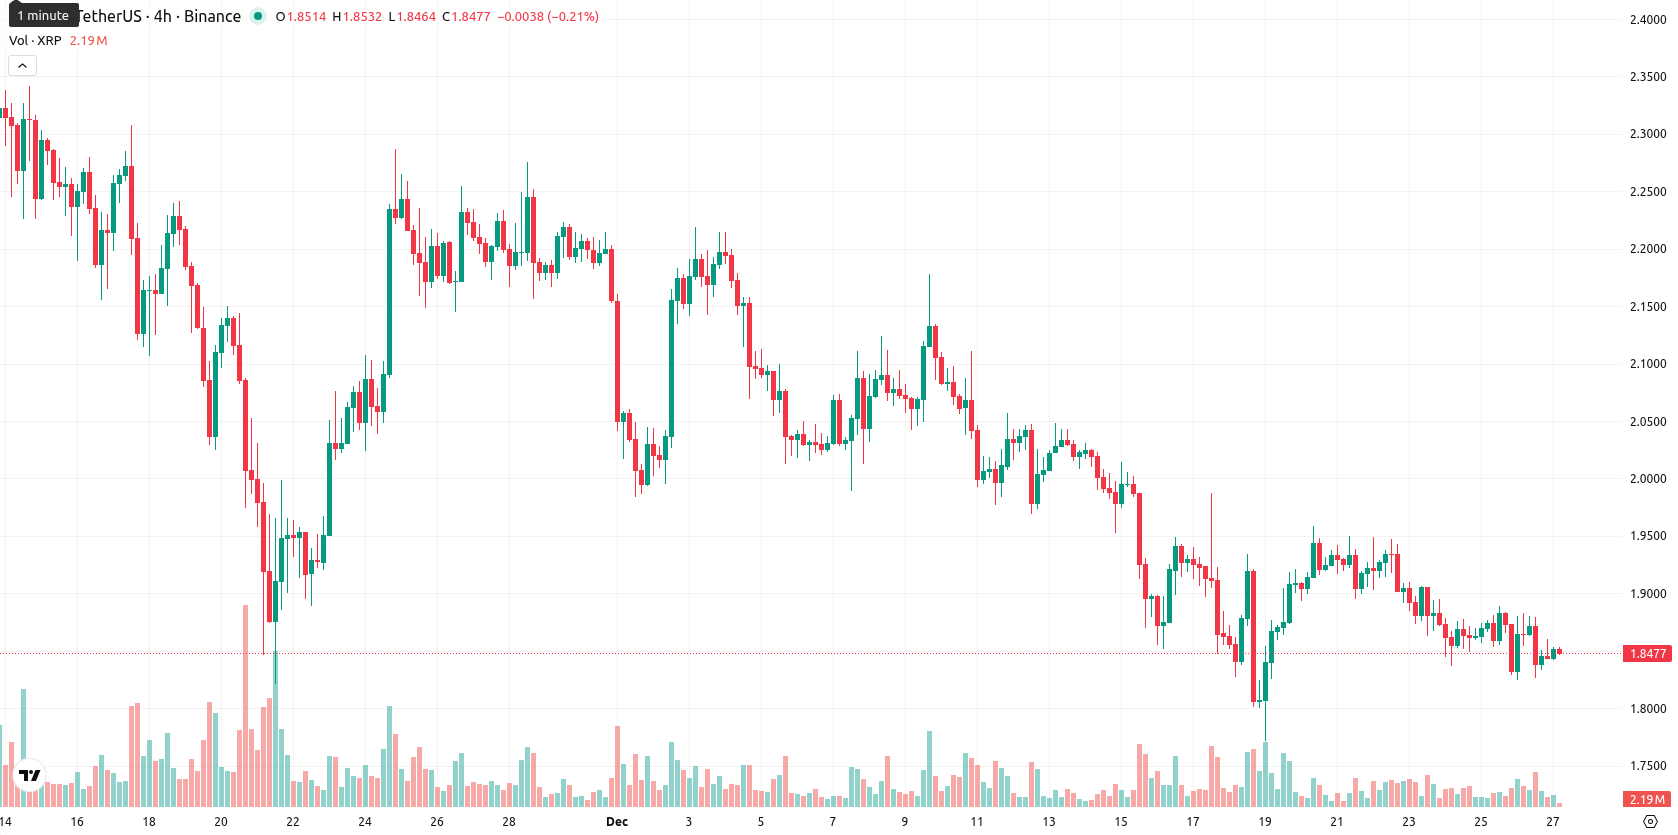
XRP is trading well below its MA-20 ($1.9444), MA-50 ($2.0910), and MA-200 ($2.5787), confirming dominant selling pressure across all key timeframes. The asset declined 1.06% today, currently fluctuating within $1.8421 – $1.8538, and sits mid-range between its immediate support and dynamic resistance at the Ichimoku Kijun level ($1.9951).
Highlights
- XRP secured a federal trust bank charter, facilitating broader institutional adoption and strengthening its foundation for future participation in regulated financial services.
- Spot XRP ETFs have attracted up to $1.25 billion in net inflows and accumulated over 1 billion XRP tokens in cold storage, supporting mainstream market integration.
- Ripple's recent financial infrastructure acquisitions and its 1 billion XRP pledge to the XRPL Japan and Korea Fund aim to drive regional adoption in Asia.
Institutional inflows and acquisitions drive mainstream XRP integration
XRP received a federal trust bank charter, enabling broader institutional adoption and boosting the foundation for future growth in regulated financial services. The emergence of spot XRP ETFs, which have attracted up to $1.25 billion in net inflows and accumulated over 1 billion XRP tokens in cold storage, is supporting the asset's integration into mainstream markets. Additional developments include Ripple's financial infrastructure acquisitions and the company's 1 billion XRP pledge to the XRPL Japan and Korea Fund to encourage regional adoption.
Technical momentum weakens as indicators reinforce broad downside bias
Technically, XRP remains under broad bearish control with momentum indicators like the MACD signaling a strong sell and the ADX confirming a negative trend. The price hovers beneath all key MAs, with resistance clustered near the Ichimoku Kijun ($1.9951) and immediate support at today's lows. Daily and weekly RSI sit below 40, indicating sustained but not yet oversold selling pressure; the Stoch RSI on D1 shows a slight buy signal, though this contradicts the overall negative momentum, and the CCI points to continued weakness. Bull/Bear Power reinforces the prevailing selling bias, while the declining Awesome Oscillator adds weight to the ongoing downside risk.
Further losses likely as resistance limits upside and technicals deteriorate
Over the next five sessions, a typical volatility band is anticipated between $1.83 and $2.05, constrained by strong resistance overhead. A decisive break above $1.9950 would be required for a bullish scenario to unfold toward $2.05, but probabilities favor further weakness. If XRP falls below $1.83, additional downside toward the next psychological support is likely, as dominant daily and weekly technical signals continue to point lower.
Last time, analysts noted that XRP is stabilizing near support after a prolonged decline, with price compressed below a cluster of falling moving averages and daily RSI signaling neutral momentum. The asset remains range-bound beneath resistance, with short-term rebounds unfolding within a broader downtrend and no decisive accumulation or breakout until critical EMAs and higher trading volumes are reclaimed.


-
 Afghanistan
-
 Albania
-
 Algeria
-
 Angola
-
 Argentina
-
 Armenia
-
 Australia
-
 Austria
-
 Azerbaijan
-
 Bahamas
-
 Bahrain
-
 Bangladesh
-
 Belarus
-
 Belgium
-
 Bolivia
-
 Botswana
-
 Brazil
-
 Brunei
-
 Bulgaria
-
 Cambodia
-
 Cameroon
-
 Canada
-
 Chile
Chile
-
 China
China
-
 Colombia
-
 Congo
Congo
-
 Costa Rica
-
 Cote d'Ivoire
-
 Croatia
-
 Cuba
Cuba
-
 Cyprus
-
 Czechia
-
 DR Congo
-
 Denmark
-
 Dominican Republic
-
 Ecuador
-
 Egypt
Egypt
-
 El Salvador
-
 Estonia
-
 Eswatini
-
 Ethiopia
-
 Finland
-
 France
-
 Georgia
-
 Germany
-
 Ghana
Ghana
-
 Greece
-
 Haiti
Haiti
-
 Hong Kong
-
 Hungary
-
 India
India
-
 Indonesia
-
 Iran, Islamic republic
-
 Iraq
Iraq
-
 Ireland
-
 Israel
-
 Italy
Italy
-
 Jamaica
-
 Japan
Japan
-
 Jordan
-
 Kazakhstan
-
 Kenya
Kenya
-
 Korea
Korea
-
 Kuwait
-
 Kyrgyzstan
-
 Laos
Laos
-
 Latvia
-
 Lebanon
-
 Lesotho
-
 Libya
Libya
-
 Lithuania
-
 Luxembourg
-
 Madagascar
-
 Malaysia
-
 Malta
Malta
-
 Mauritius
-
 Mexico
-
 Moldova
-
 Mongolia
-
 Montenegro
-
 Morocco
-
 Mozambique
-
 Myanmar
-
 Namibia
-
 Nepal
Nepal
-
 Netherlands
-
 New Zealand
-
 Nigeria
-
 North Macedonia
-
 Norway
-
 Oman
Oman
-
 Pakistan
-
 Palestine
-
 Panama
-
 Papua New Guinea
-
 Paraguay
-
 Peru
Peru
-
 Philippines
-
 Poland
-
 Portugal
-
 Puerto Rico
-
 Qatar
Qatar
-
 Reunion
-
 Romania
-
 Rwanda
-
 Saudi Arabia
-
 Serbia
-
 Singapore
-
 Slovakia
-
 Slovenia
-
 Somalia
-
 South Africa
-
 Spain
Spain
-
 Sri Lanka
-
 Sweden
-
 Switzerland
-
 Syria
Syria
-
 Taiwan
-
 Tajikistan
-
 Tanzania
-
 Thailand
-
 Trinidad and Tobago
-
 Tunisia
-
 Turkey
-
 UAE
UAE
-
 Uganda
-
 Ukraine
-
 United Kingdom
-
United States
-
 Uruguay
-
 Uzbekistan
-
 Venezuela
-
 Vietnam
-
 Yemen
Yemen
-
 Zambia
-
 Zimbabwe
- Forex
- Crypto
