
Official Trump: bearish momentum overshadows possible sideways move

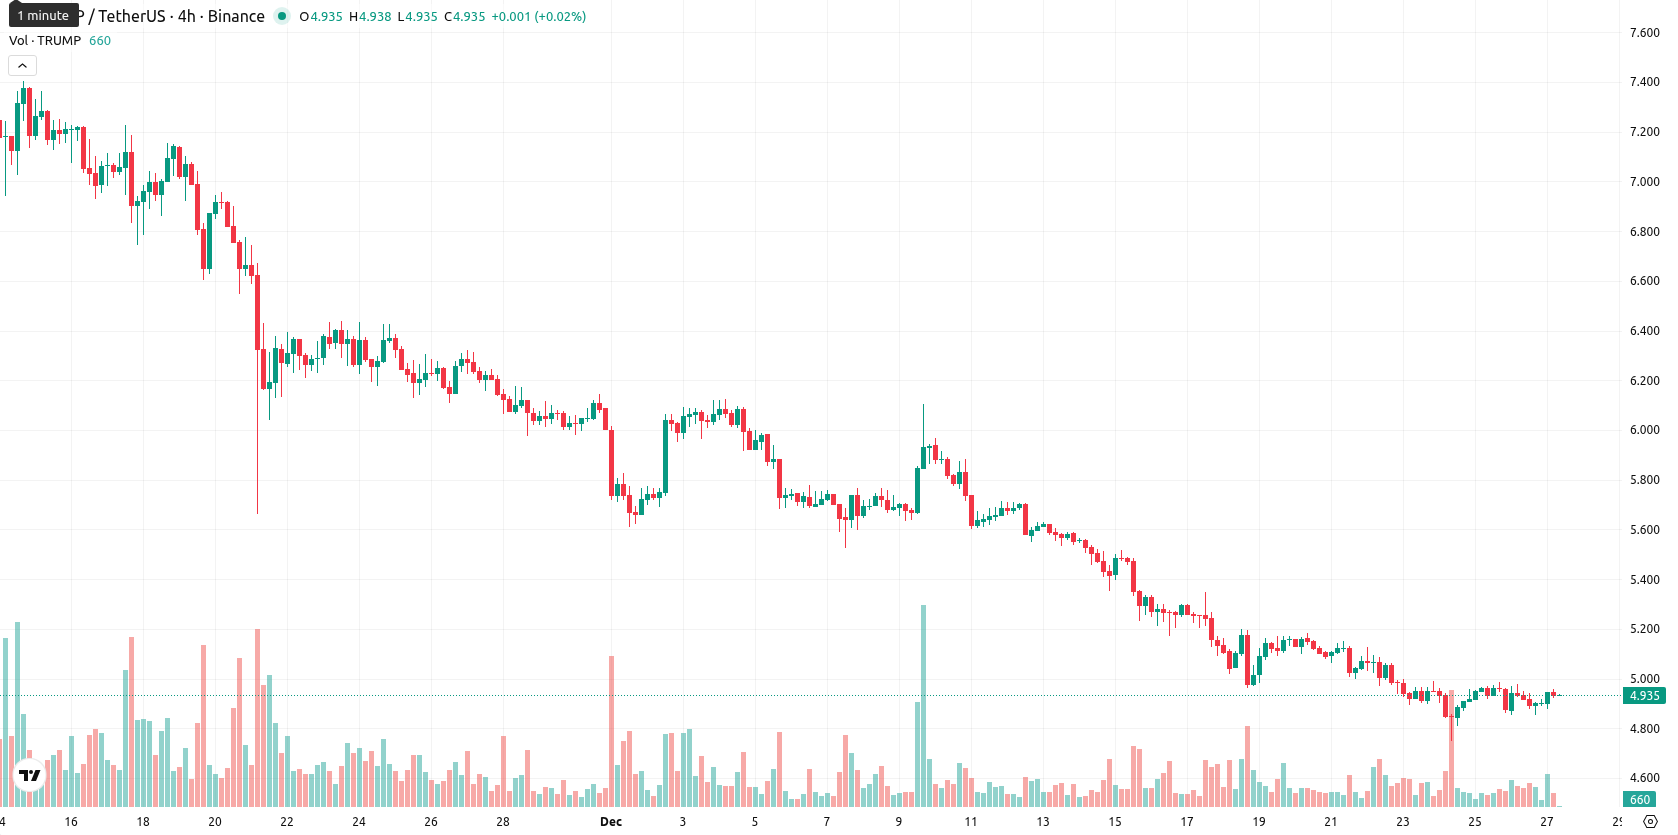
Official Trump (TRUMP) is trading at $4.94, below its MA-20 ($5.30), MA-50 ($6.13), and MA-200 ($7.91), which signals pressure from sellers across all major timeframes.
Highlights
- TRUMP trades at $4.94, below MA-20 ($5.30), MA-50 ($6.13), and MA-200 ($7.91), indicating sustained multi-timeframe bearish pressure.
- Oversold signals dominate with RSI at 28.54, Stoch RSI at 14.15, and CCI at -91.20, while MACD (-0.41) and ADX (29.67) confirm downside momentum.
- Probability of further decline exceeds 80% over the next five trading days, with a likely range of $4.70 to $5.30 and minimal prospects for reversal.
Oversold momentum persists as bearish signals converge at resistance
The nearest dynamic resistance is the Ichimoku Kijun at $5.45, while immediate dynamic support is not indicated by the provided Ichimoku value. Momentum signals are predominantly bearish, as both D1 MACD (strong sell, -0.41) and ADX (sell, 29.67) highlight downside strength. The asset is oversold by several measures: RSI stands at 28.54, Stoch RSI at 14.15, and CCI at -91.20, suggesting selling momentum is extended. Intraday, the BBP at -0.13 indicates sellers remain dominant, and the Awesome Oscillator is neutral, offering no countertrend support. There is some divergence as oversold conditions emerge while daily momentum retains a negative bias.
Further downside risk as breakout levels define near-term fate
For the next five trading days, a typical volatility band relative to current levels is $4.70 to $5.30. The probability of further decline is very high (more than 80%), while the chance of a meaningful upward reversal is very low. In the baseline scenario, price action remains within a sideways corridor, anchored around the $4.90 – $5.10 region. A bullish scenario would require a decisive break above $5.45, enabling upside momentum, while a bearish move below $4.70 could open up further downside if selling intensifies.
Previously it was reported that Official Trump (TRUMP) is trading at $4.95, remaining below major moving averages with momentum indicators and oscillators signaling persistent bearish pressure and deeply oversold conditions. Near-term support is at $4.85 with resistance at $5.46, and price is expected to remain rangebound as the probability of a recovery is low and downside risks persist.


-
 Afghanistan
-
 Albania
-
 Algeria
-
 Angola
-
 Argentina
-
 Armenia
-
 Australia
-
 Austria
-
 Azerbaijan
-
 Bahamas
-
 Bahrain
-
 Bangladesh
-
 Belarus
-
 Belgium
-
 Bolivia
-
 Botswana
-
 Brazil
-
 Brunei
-
 Bulgaria
-
 Cambodia
-
 Cameroon
-
 Canada
-
 Chile
Chile
-
 China
China
-
 Colombia
-
 Congo
Congo
-
 Costa Rica
-
 Cote d'Ivoire
-
 Croatia
-
 Cuba
Cuba
-
 Cyprus
-
 Czechia
-
 DR Congo
-
 Denmark
-
 Dominican Republic
-
 Ecuador
-
 Egypt
Egypt
-
 El Salvador
-
 Estonia
-
 Eswatini
-
 Ethiopia
-
 Finland
-
 France
-
 Georgia
-
 Germany
-
 Ghana
Ghana
-
 Greece
-
 Haiti
Haiti
-
 Hong Kong
-
 Hungary
-
 India
India
-
 Indonesia
-
 Iran, Islamic republic
-
 Iraq
Iraq
-
 Ireland
-
 Israel
-
 Italy
Italy
-
 Jamaica
-
 Japan
Japan
-
 Jordan
-
 Kazakhstan
-
 Kenya
Kenya
-
 Korea
Korea
-
 Kuwait
-
 Kyrgyzstan
-
 Laos
Laos
-
 Latvia
-
 Lebanon
-
 Lesotho
-
 Libya
Libya
-
 Lithuania
-
 Luxembourg
-
 Madagascar
-
 Malaysia
-
 Malta
Malta
-
 Mauritius
-
 Mexico
-
 Moldova
-
 Mongolia
-
 Montenegro
-
 Morocco
-
 Mozambique
-
 Myanmar
-
 Namibia
-
 Nepal
Nepal
-
 Netherlands
-
 New Zealand
-
 Nigeria
-
 North Macedonia
-
 Norway
-
 Oman
Oman
-
 Pakistan
-
 Palestine
-
 Panama
-
 Papua New Guinea
-
 Paraguay
-
 Peru
Peru
-
 Philippines
-
 Poland
-
 Portugal
-
 Puerto Rico
-
 Qatar
Qatar
-
 Reunion
-
 Romania
-
 Rwanda
-
 Saudi Arabia
-
 Serbia
-
 Singapore
-
 Slovakia
-
 Slovenia
-
 Somalia
-
 South Africa
-
 Spain
Spain
-
 Sri Lanka
-
 Sweden
-
 Switzerland
-
 Syria
Syria
-
 Taiwan
-
 Tajikistan
-
 Tanzania
-
 Thailand
-
 Trinidad and Tobago
-
 Tunisia
-
 Turkey
-
 UAE
UAE
-
 Uganda
-
 Ukraine
-
 United Kingdom
-
United States
-
 Uruguay
-
 Uzbekistan
-
 Venezuela
-
 Vietnam
-
 Yemen
Yemen
-
 Zambia
-
 Zimbabwe
- Forex
- Crypto
